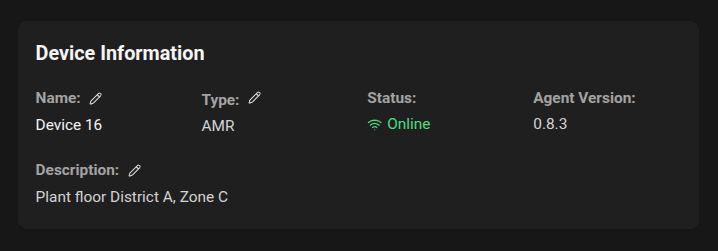
 If the device shows "Offline":
* Check the device's network and power.
* If problems persist, see the Troubleshooting section below or contact your administrator.
## Sources
The Sources section lists data sources that the agent has discovered on the device. This typically includes:
* Host metrics: CPU, memory, disk, and network usage from the device's operating system. This are always collected by the agent once it's running.
* ROS2: If the device is running ROS2 and the agent has detected it, it will show up here with details about the ROS2 topics being monitored.
If the device shows "Offline":
* Check the device's network and power.
* If problems persist, see the Troubleshooting section below or contact your administrator.
## Sources
The Sources section lists data sources that the agent has discovered on the device. This typically includes:
* Host metrics: CPU, memory, disk, and network usage from the device's operating system. This are always collected by the agent once it's running.
* ROS2: If the device is running ROS2 and the agent has detected it, it will show up here with details about the ROS2 topics being monitored.
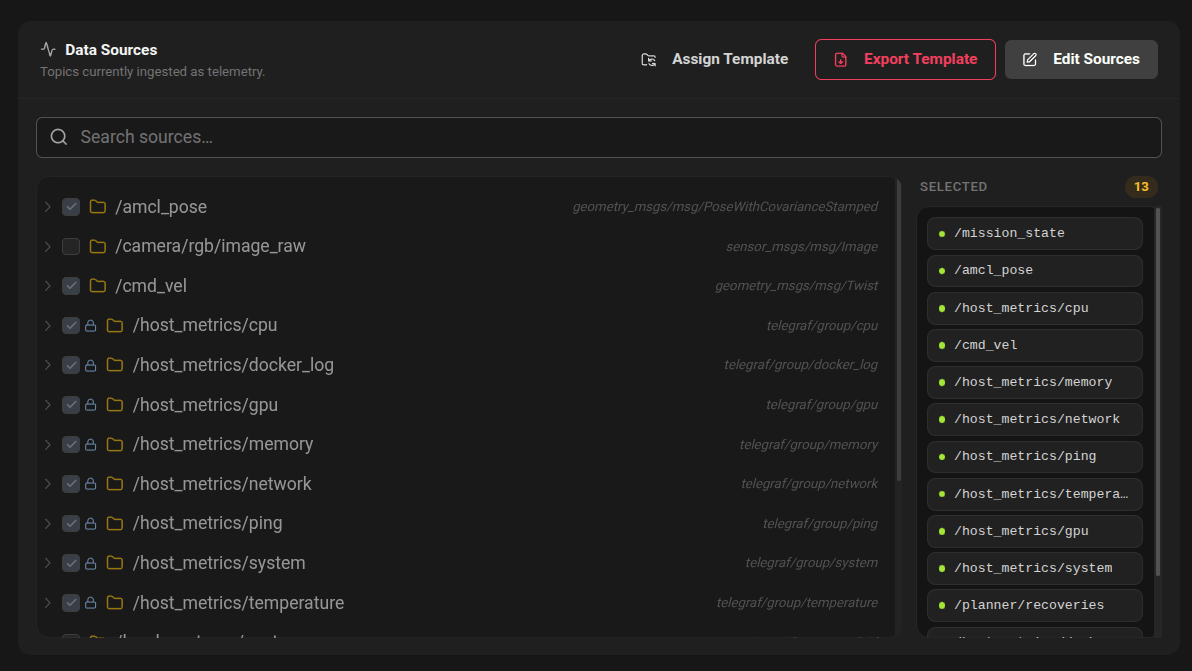 To start monitoring new sources, check the corresponding box in the Sources section and click Save changes. The agent will begin collecting data from those sources and they will appear in the dashboard within a few minutes.
There is no need to restart the agent or the device.
## OpenTelemetry inventory and toggle
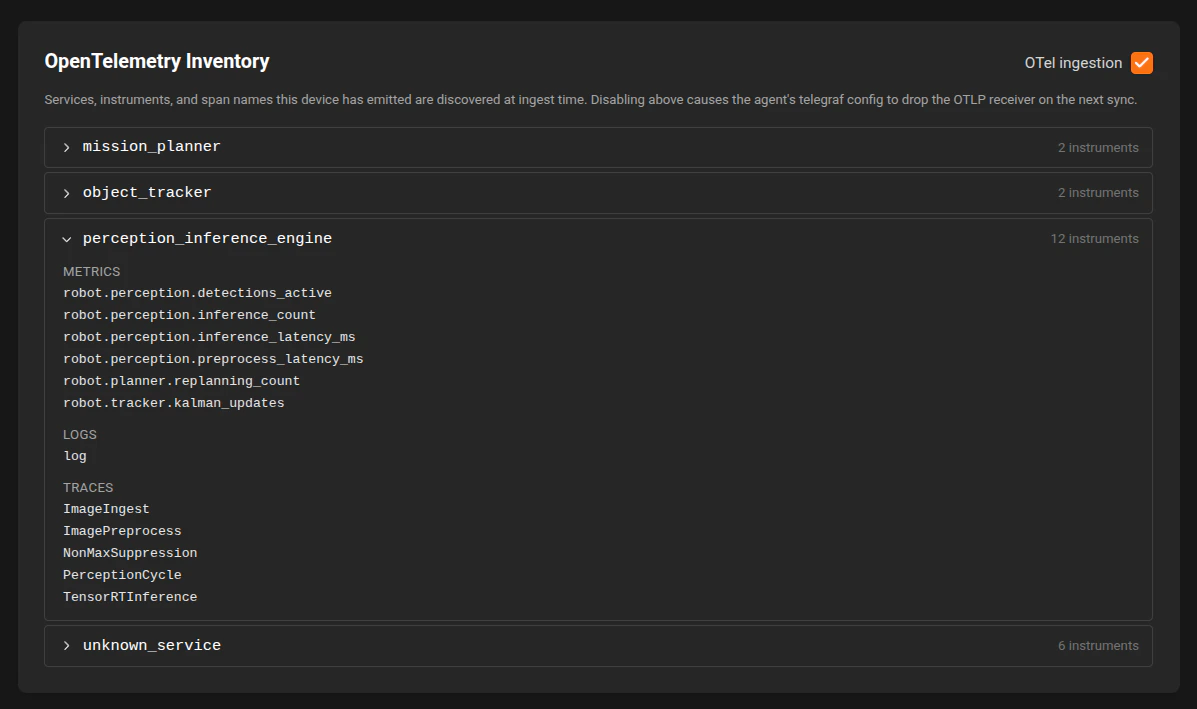
The Device Details page also includes an OpenTelemetry Inventory section.
* OTel ingestion is enabled by default.
* Use the OTel ingestion toggle to enable or disable OpenTelemetry collection for that device.
* The inventory lists discovered services and their emitted metrics, logs, and traces.
If no entries are shown yet, the device may not have emitted OTel data in the selected period.
To start sending data from your app, point your OpenTelemetry exporter to:
* Endpoint: [http://127.0.0.1:4317](http://127.0.0.1:4317)
* Protocol: OTLP/gRPC
For dashboard query setup with otel\_metrics, otel\_logs, and otel\_traces, see [OpenTelemetry in Monitoring](/monitoring/opentelemetry).
To start monitoring new sources, check the corresponding box in the Sources section and click Save changes. The agent will begin collecting data from those sources and they will appear in the dashboard within a few minutes.
There is no need to restart the agent or the device.
## OpenTelemetry inventory and toggle
The Device Details page also includes an OpenTelemetry Inventory section.
* OTel ingestion is enabled by default.
* Use the OTel ingestion toggle to enable or disable OpenTelemetry collection for that device.
* The inventory lists discovered services and their emitted metrics, logs, and traces.
If no entries are shown yet, the device may not have emitted OTel data in the selected period.
To start sending data from your app, point your OpenTelemetry exporter to:
* Endpoint: [http://127.0.0.1:4317](http://127.0.0.1:4317)
* Protocol: OTLP/gRPC
For dashboard query setup with otel\_metrics, otel\_logs, and otel\_traces, see [OpenTelemetry in Monitoring](/monitoring/opentelemetry).
 ## Metadata
The Metadata section allows you to add custom key-value pairs to help identify and organize devices. Common metadata includes:
* Software versions
* Hardware serial numbers
* Firmware versions
* Hardware models
## Metadata
The Metadata section allows you to add custom key-value pairs to help identify and organize devices. Common metadata includes:
* Software versions
* Hardware serial numbers
* Firmware versions
* Hardware models
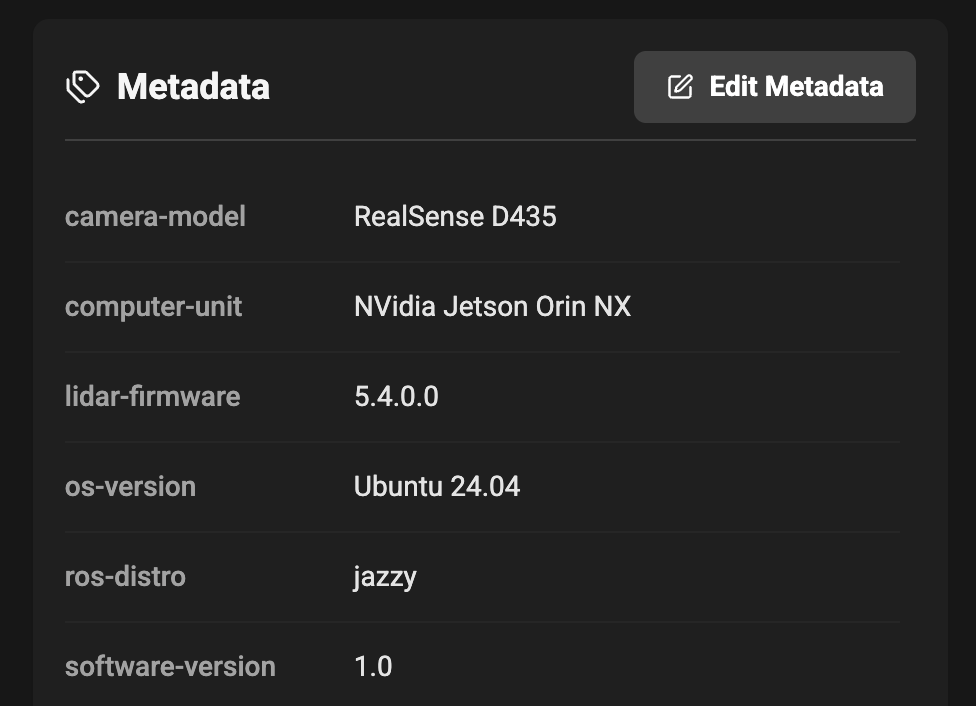 Metadata serves as tags for advanced filtering, grouping and to compare devices in dashboards and alerts. You can add, edit, or remove metadata entries at any time. Changes take effect immediately.
## Best practices
* Give devices meaningful names (ID + role, e.g. "AMR Sector 4B") so they are easy to find.
* Add a short description with installation notes (mounting location, contacts, or serial numbers).
* Complete the setup right after provisioning devices to avoid confusion in dashboards or alerts.
Metadata serves as tags for advanced filtering, grouping and to compare devices in dashboards and alerts. You can add, edit, or remove metadata entries at any time. Changes take effect immediately.
## Best practices
* Give devices meaningful names (ID + role, e.g. "AMR Sector 4B") so they are easy to find.
* Add a short description with installation notes (mounting location, contacts, or serial numbers).
* Complete the setup right after provisioning devices to avoid confusion in dashboards or alerts.