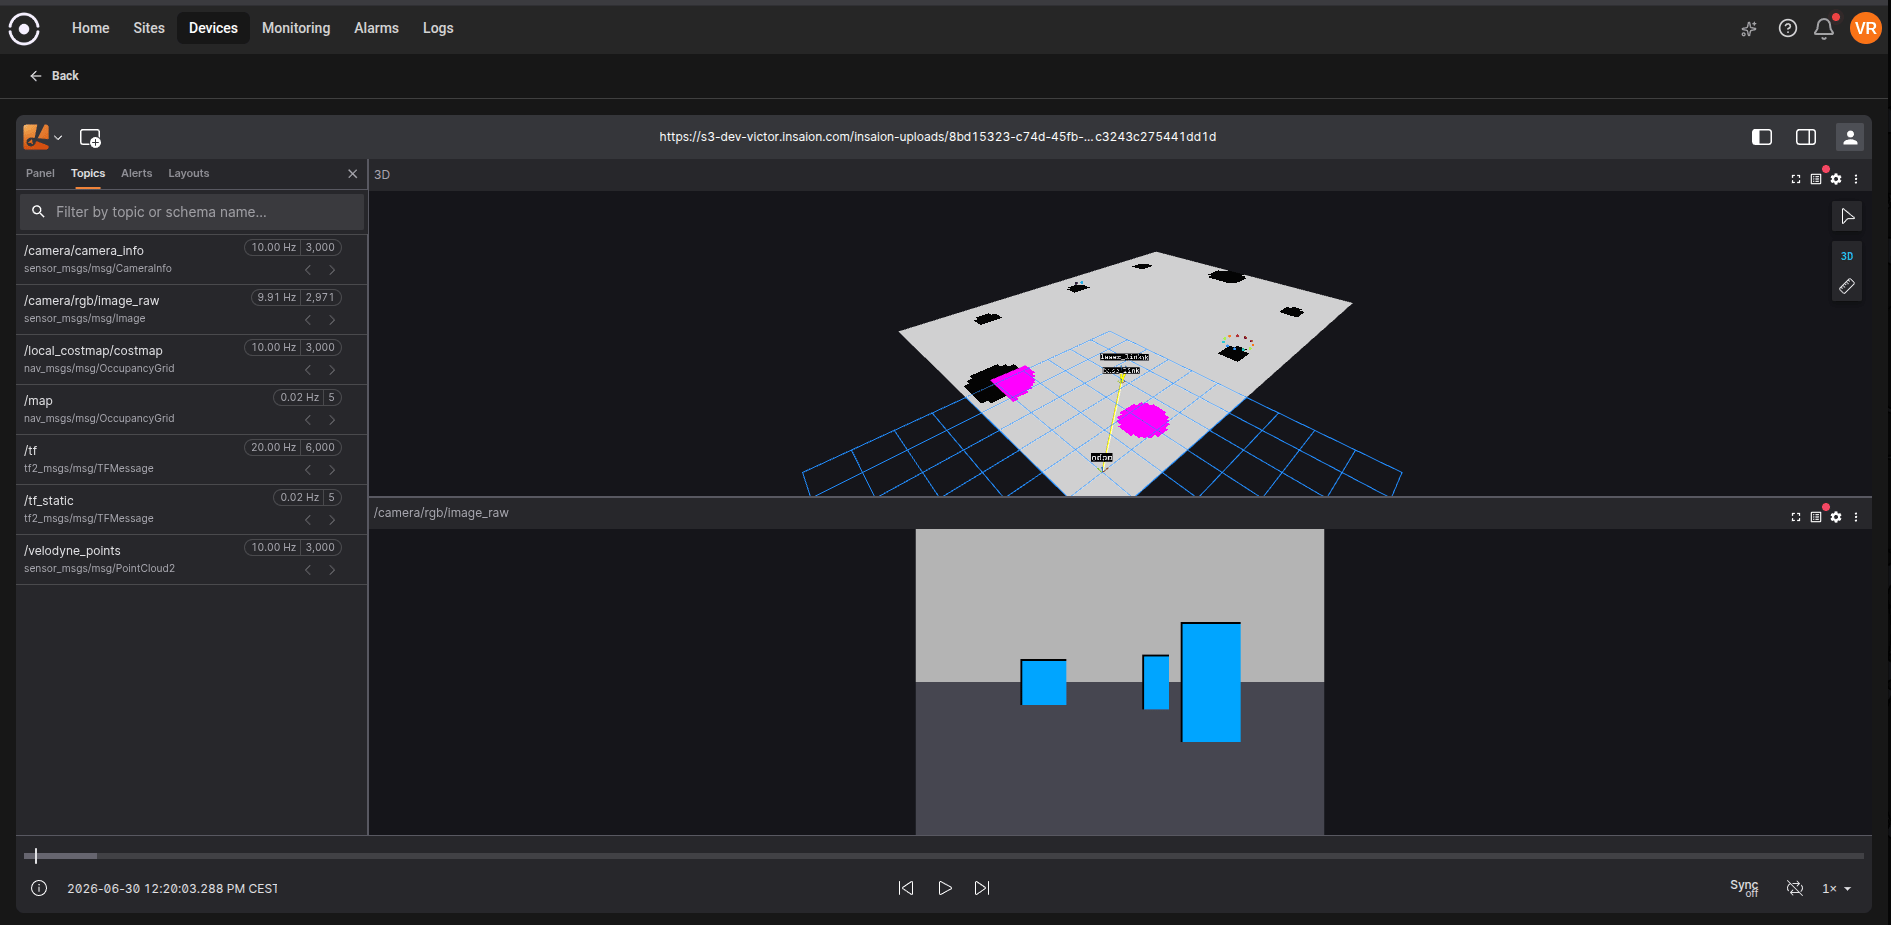
 ### Main areas of the visualizer
* Left navigation: Choose the active workspace component (for example, the Topic Explorer or Chat). This quickly switches the main content area between exploring topics and conversing with Copilot.
* Center workspace: The area where plots and visual panels appear. Each panel (or "pane") can show one or more plots, and you can rearrange panes to match how you like to analyze data.
* Right-side timeline/controls: A compact timeline and playback controls that let you zoom and move through the recording period. Colored intervals (annotations) are shown on the timeline to highlight important sections.
* Top / side toolbars: Quick actions to add plots, save or load visualizer layouts, and change view options.
### Common workflows
* Quick inspection: Drag a topic's most important field into a pane and zoom the timeline to the period you care about.
* Compare signals: Add multiple fields to the same pane to see how they move together across time.
* Annotate and share: Mark an interval where a problem occurred, add a note, then share the session or save the visualizer layout for teammates.
* Use the chat for help: Ask the assistant to suggest plots or create a visualizer layout for common analysis tasks.
***
### Main areas of the visualizer
* Left navigation: Choose the active workspace component (for example, the Topic Explorer or Chat). This quickly switches the main content area between exploring topics and conversing with Copilot.
* Center workspace: The area where plots and visual panels appear. Each panel (or "pane") can show one or more plots, and you can rearrange panes to match how you like to analyze data.
* Right-side timeline/controls: A compact timeline and playback controls that let you zoom and move through the recording period. Colored intervals (annotations) are shown on the timeline to highlight important sections.
* Top / side toolbars: Quick actions to add plots, save or load visualizer layouts, and change view options.
### Common workflows
* Quick inspection: Drag a topic's most important field into a pane and zoom the timeline to the period you care about.
* Compare signals: Add multiple fields to the same pane to see how they move together across time.
* Annotate and share: Mark an interval where a problem occurred, add a note, then share the session or save the visualizer layout for teammates.
* Use the chat for help: Ask the assistant to suggest plots or create a visualizer layout for common analysis tasks.
***