 ## 2) Send OTel data to the correct endpoint
By default, the agent listens for OTLP/gRPC on:
* Host: 127.0.0.1
* Port: 4317
* Endpoint: [http://127.0.0.1:4317](http://127.0.0.1:4317)
Use this endpoint in your OpenTelemetry SDK exporter settings.
Example environment variables for many SDKs:
```bash theme={null}
OTEL_EXPORTER_OTLP_ENDPOINT=http://127.0.0.1:4317
OTEL_EXPORTER_OTLP_PROTOCOL=grpc
```
Notes:
* 127.0.0.1 means the exporter must run in the same network namespace as the agent listener.
* If your app runs in a separate container, point it to the host endpoint that reaches the device listener.
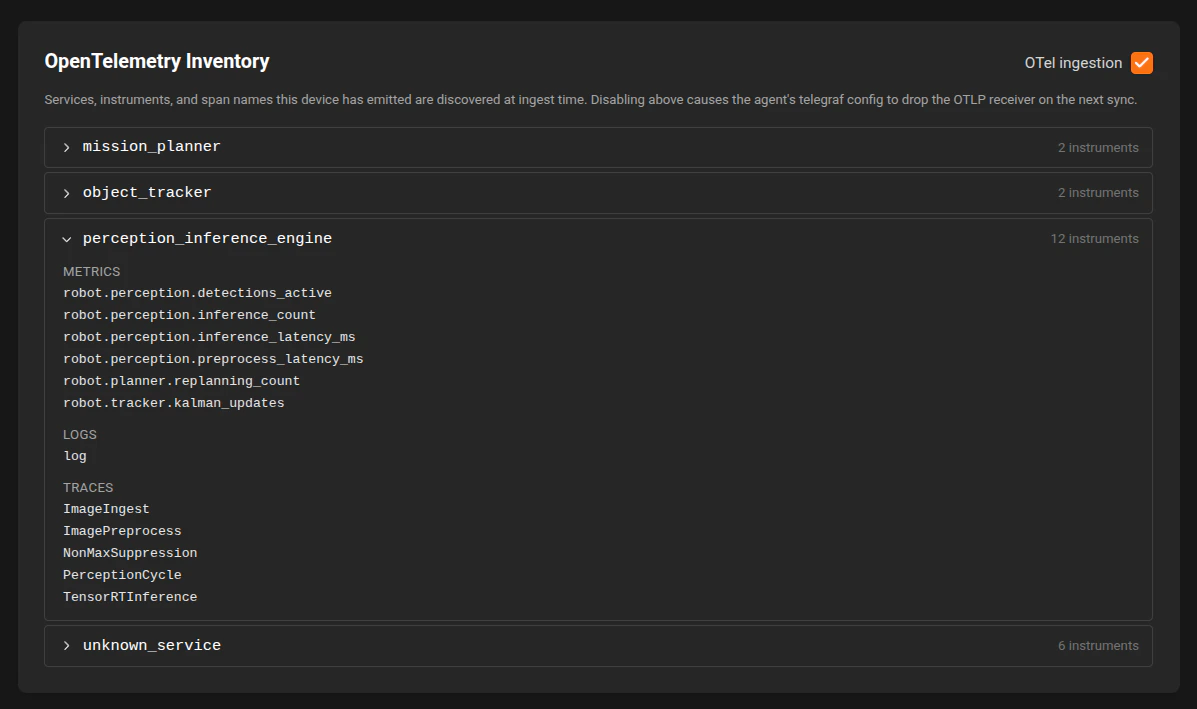
* If you send data but see nothing in dashboards, first verify the OTel ingestion toggle is on.
## 3) Query OTel data in the dashboard Query Builder
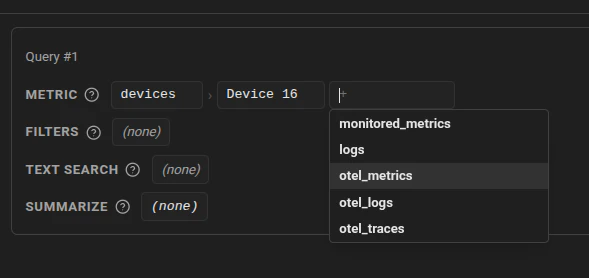
When configuring a panel query, the Query Builder includes OTel data sources.
You will see:
* otel\_metrics
* otel\_logs
* otel\_traces
Recommended usage:
* Use otel\_metrics for Timeseries, Stat, and Gauge panels.
* Use otel\_logs for Logs panels.
* Use otel\_traces when you want to explore traces available for the selected range and source.
## 2) Send OTel data to the correct endpoint
By default, the agent listens for OTLP/gRPC on:
* Host: 127.0.0.1
* Port: 4317
* Endpoint: [http://127.0.0.1:4317](http://127.0.0.1:4317)
Use this endpoint in your OpenTelemetry SDK exporter settings.
Example environment variables for many SDKs:
```bash theme={null}
OTEL_EXPORTER_OTLP_ENDPOINT=http://127.0.0.1:4317
OTEL_EXPORTER_OTLP_PROTOCOL=grpc
```
Notes:
* 127.0.0.1 means the exporter must run in the same network namespace as the agent listener.
* If your app runs in a separate container, point it to the host endpoint that reaches the device listener.
* If you send data but see nothing in dashboards, first verify the OTel ingestion toggle is on.
## 3) Query OTel data in the dashboard Query Builder
When configuring a panel query, the Query Builder includes OTel data sources.
You will see:
* otel\_metrics
* otel\_logs
* otel\_traces
Recommended usage:
* Use otel\_metrics for Timeseries, Stat, and Gauge panels.
* Use otel\_logs for Logs panels.
* Use otel\_traces when you want to explore traces available for the selected range and source.
 ## 4) Use the new Logs Query workflow
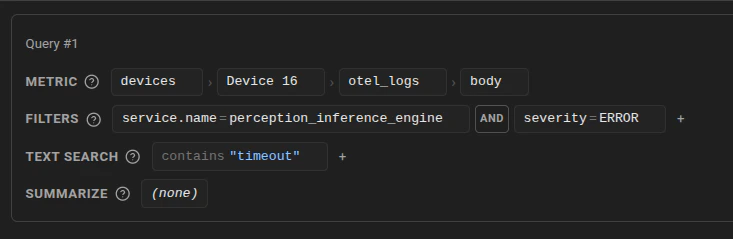
For Logs panels, use Log Text Search in the query builder.
Available match types:
* contains
* does not contain
* matches regex
Examples:
* contains: timeout
* does not contain: healthcheck
* matches regex: (?i)\b(error|critical|fatal)\b
## 4) Use the new Logs Query workflow
For Logs panels, use Log Text Search in the query builder.
Available match types:
* contains
* does not contain
* matches regex
Examples:
* contains: timeout
* does not contain: healthcheck
* matches regex: (?i)\b(error|critical|fatal)\b
 Practical tip:
* Start with a broad contains filter, then tighten with regex if you need exact severity patterns.
## 5) Understand trace discovery in dashboards
Trace exploration is integrated into logs and timeseries workflows:
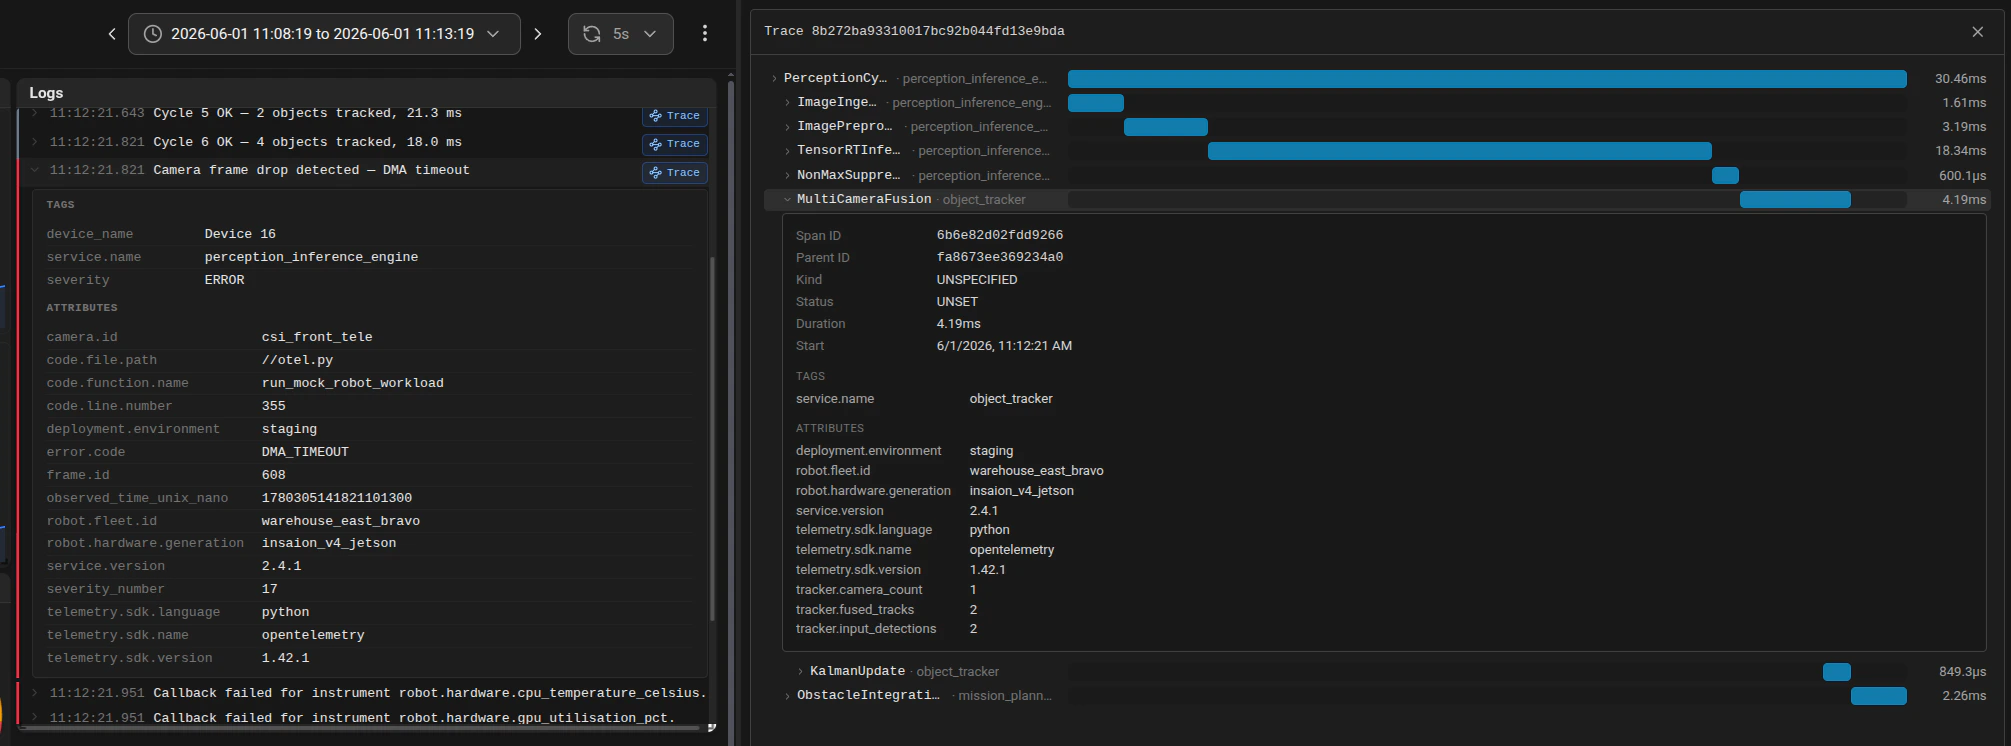
* In Logs panels, rows with a detected trace id show a Trace action.
* In expanded log details, trace\_id values are clickable.
* In Timeseries panels, trace exemplars can appear as markers.
* Clicking a trace marker or trace action opens the trace drawer.
Practical tip:
* Start with a broad contains filter, then tighten with regex if you need exact severity patterns.
## 5) Understand trace discovery in dashboards
Trace exploration is integrated into logs and timeseries workflows:
* In Logs panels, rows with a detected trace id show a Trace action.
* In expanded log details, trace\_id values are clickable.
* In Timeseries panels, trace exemplars can appear as markers.
* Clicking a trace marker or trace action opens the trace drawer.
 Important:
* Trace drill-down is detection-driven. You usually discover traces from logs or metric exemplars, then open them.
* You may not always begin from a standalone trace search flow.
## Troubleshooting checklist
If data is missing:
* Confirm the device is online.
* Confirm OTel ingestion is enabled in Device Details.
* Confirm exporter endpoint is [http://127.0.0.1:4317](http://127.0.0.1:4317) and protocol is OTLP/gRPC.
* Confirm your selected dashboard time range includes recent events.
* Confirm your panel query data source matches the signal type (otel\_metrics, otel\_logs, or otel\_traces).
***
Important:
* Trace drill-down is detection-driven. You usually discover traces from logs or metric exemplars, then open them.
* You may not always begin from a standalone trace search flow.
## Troubleshooting checklist
If data is missing:
* Confirm the device is online.
* Confirm OTel ingestion is enabled in Device Details.
* Confirm exporter endpoint is [http://127.0.0.1:4317](http://127.0.0.1:4317) and protocol is OTLP/gRPC.
* Confirm your selected dashboard time range includes recent events.
* Confirm your panel query data source matches the signal type (otel\_metrics, otel\_logs, or otel\_traces).
***