 ***
## Logs
What it shows
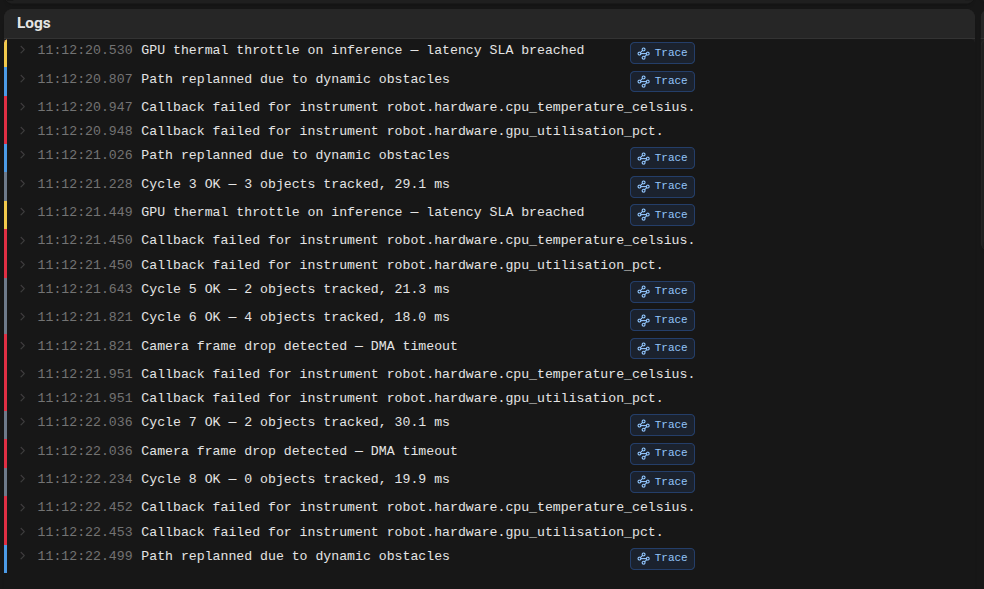
* A paginated or streaming view of log entries. Each row is a log event with timestamp and structured fields.
When to use it
* Investigate events, errors, or textual traces emitted by devices and services.
Interactions and info available
* Use Log Text Search in panel query settings with: contains, does not contain, or matches regex.
* Severity and level values are surfaced with stronger visual cues to make important lines stand out.
* Tag values are shown inline and in expandable detail rows for faster triage.
* If a trace id is detected in a row, use the Trace action to open that trace immediately.
* Click an entry to expand details and inspect related fields.
* Tail or stream live logs when the dashboard is in live mode.
***
## Logs
What it shows
* A paginated or streaming view of log entries. Each row is a log event with timestamp and structured fields.
When to use it
* Investigate events, errors, or textual traces emitted by devices and services.
Interactions and info available
* Use Log Text Search in panel query settings with: contains, does not contain, or matches regex.
* Severity and level values are surfaced with stronger visual cues to make important lines stand out.
* Tag values are shown inline and in expandable detail rows for faster triage.
* If a trace id is detected in a row, use the Trace action to open that trace immediately.
* Click an entry to expand details and inspect related fields.
* Tail or stream live logs when the dashboard is in live mode.
 ***
## Trace drill-down
What it shows
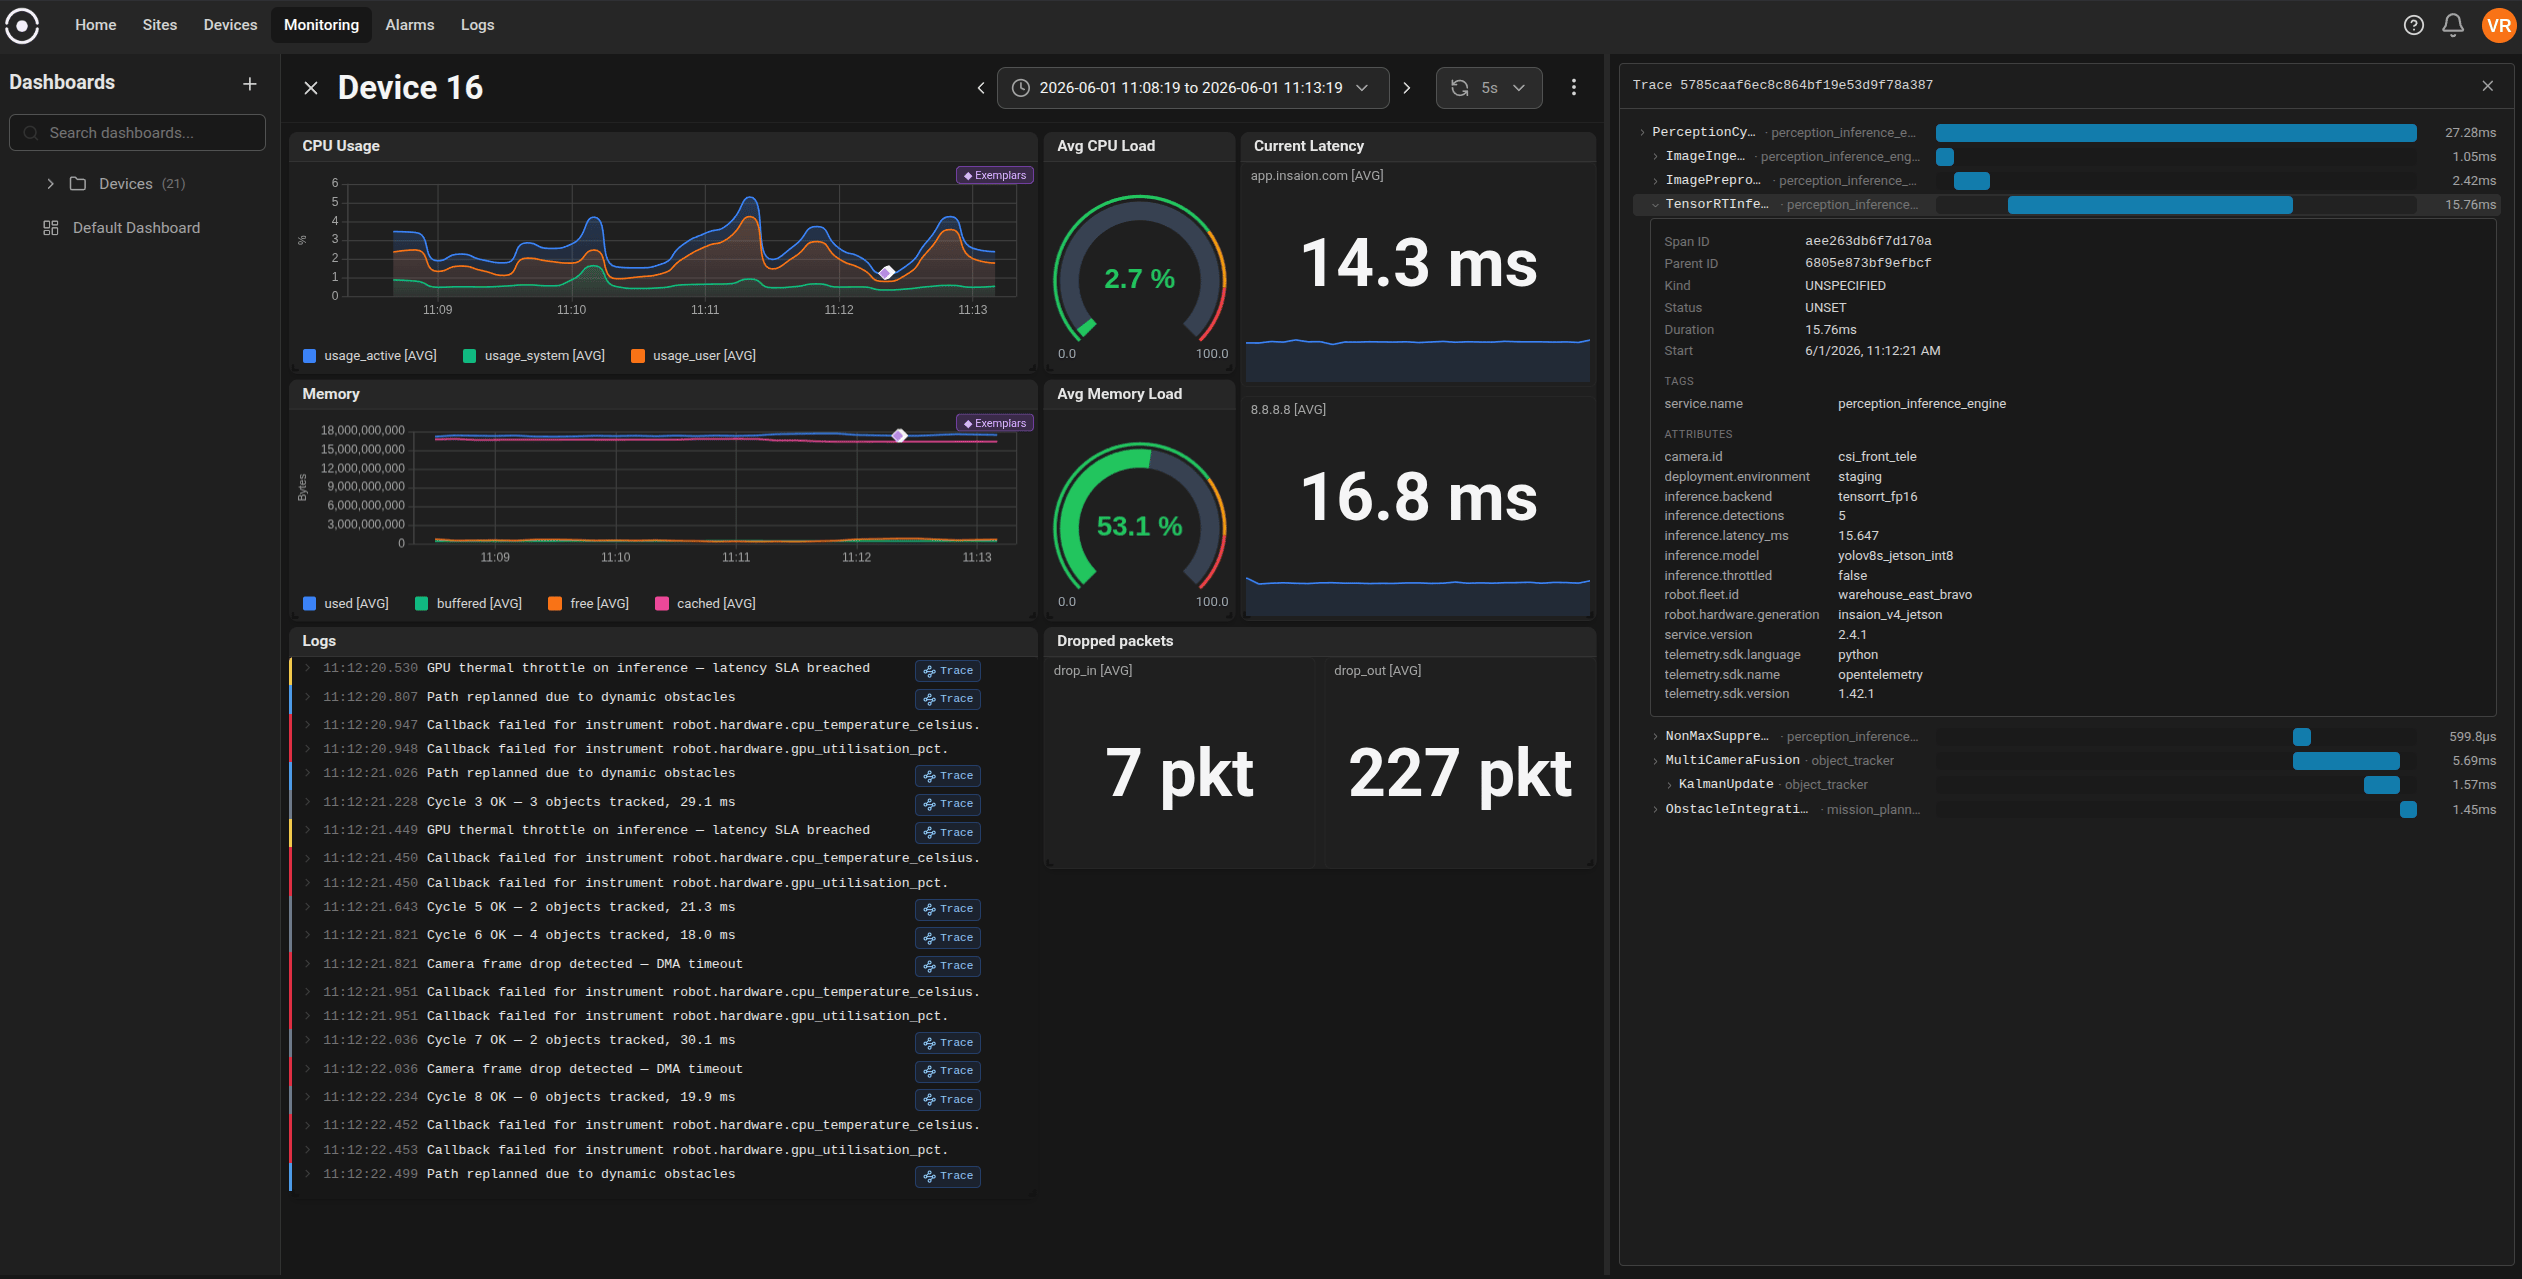
* A trace waterfall and span details opened from related logs or metric exemplars.
When to use it
* Move from symptoms to root cause by jumping from a log line or timeseries marker into a full trace view.
Interactions and info available
* Open from Logs: click Trace on a row with a detected trace id.
* Open from Timeseries: click a trace exemplar marker.
* Review span hierarchy, timing, and service-level context in the trace drawer.
***
## Trace drill-down
What it shows
* A trace waterfall and span details opened from related logs or metric exemplars.
When to use it
* Move from symptoms to root cause by jumping from a log line or timeseries marker into a full trace view.
Interactions and info available
* Open from Logs: click Trace on a row with a detected trace id.
* Open from Timeseries: click a trace exemplar marker.
* Review span hierarchy, timing, and service-level context in the trace drawer.
 Tip:
* Trace discovery is context-driven. If you do not see traces immediately, narrow the time range around an incident and check related logs/metrics first.
***
## Gauge
What it shows
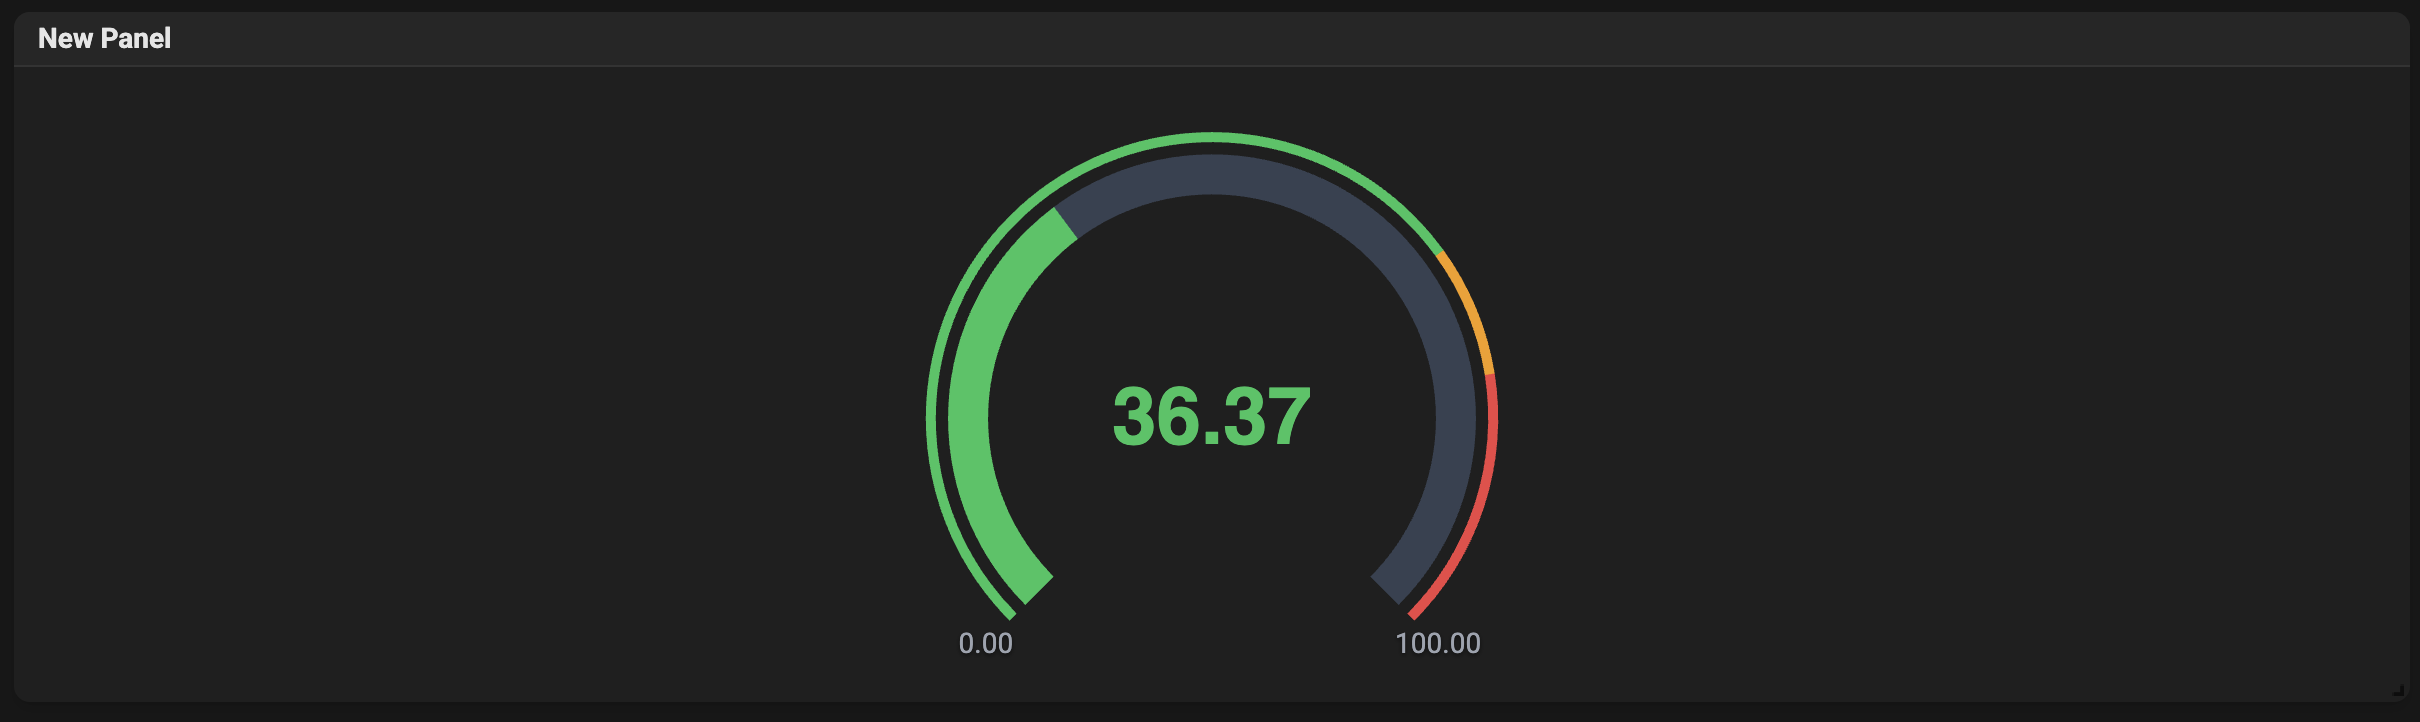
* A single-value radial gauge that highlights the current value relative to configured min/max and thresholds.
When to use it
* Monitor a single key indicator that needs to be visible at a glance, such as CPU usage, battery level, or temperature.
Interactions and info available
* Numeric value and optional progress visualization in the ring.
* Threshold colors indicate normal, warning, or critical ranges.
* Configure min/max, thresholds, units, and number of decimals in the panel settings.
Tip:
* Trace discovery is context-driven. If you do not see traces immediately, narrow the time range around an incident and check related logs/metrics first.
***
## Gauge
What it shows
* A single-value radial gauge that highlights the current value relative to configured min/max and thresholds.
When to use it
* Monitor a single key indicator that needs to be visible at a glance, such as CPU usage, battery level, or temperature.
Interactions and info available
* Numeric value and optional progress visualization in the ring.
* Threshold colors indicate normal, warning, or critical ranges.
* Configure min/max, thresholds, units, and number of decimals in the panel settings.
 ***
## Stat
What it shows
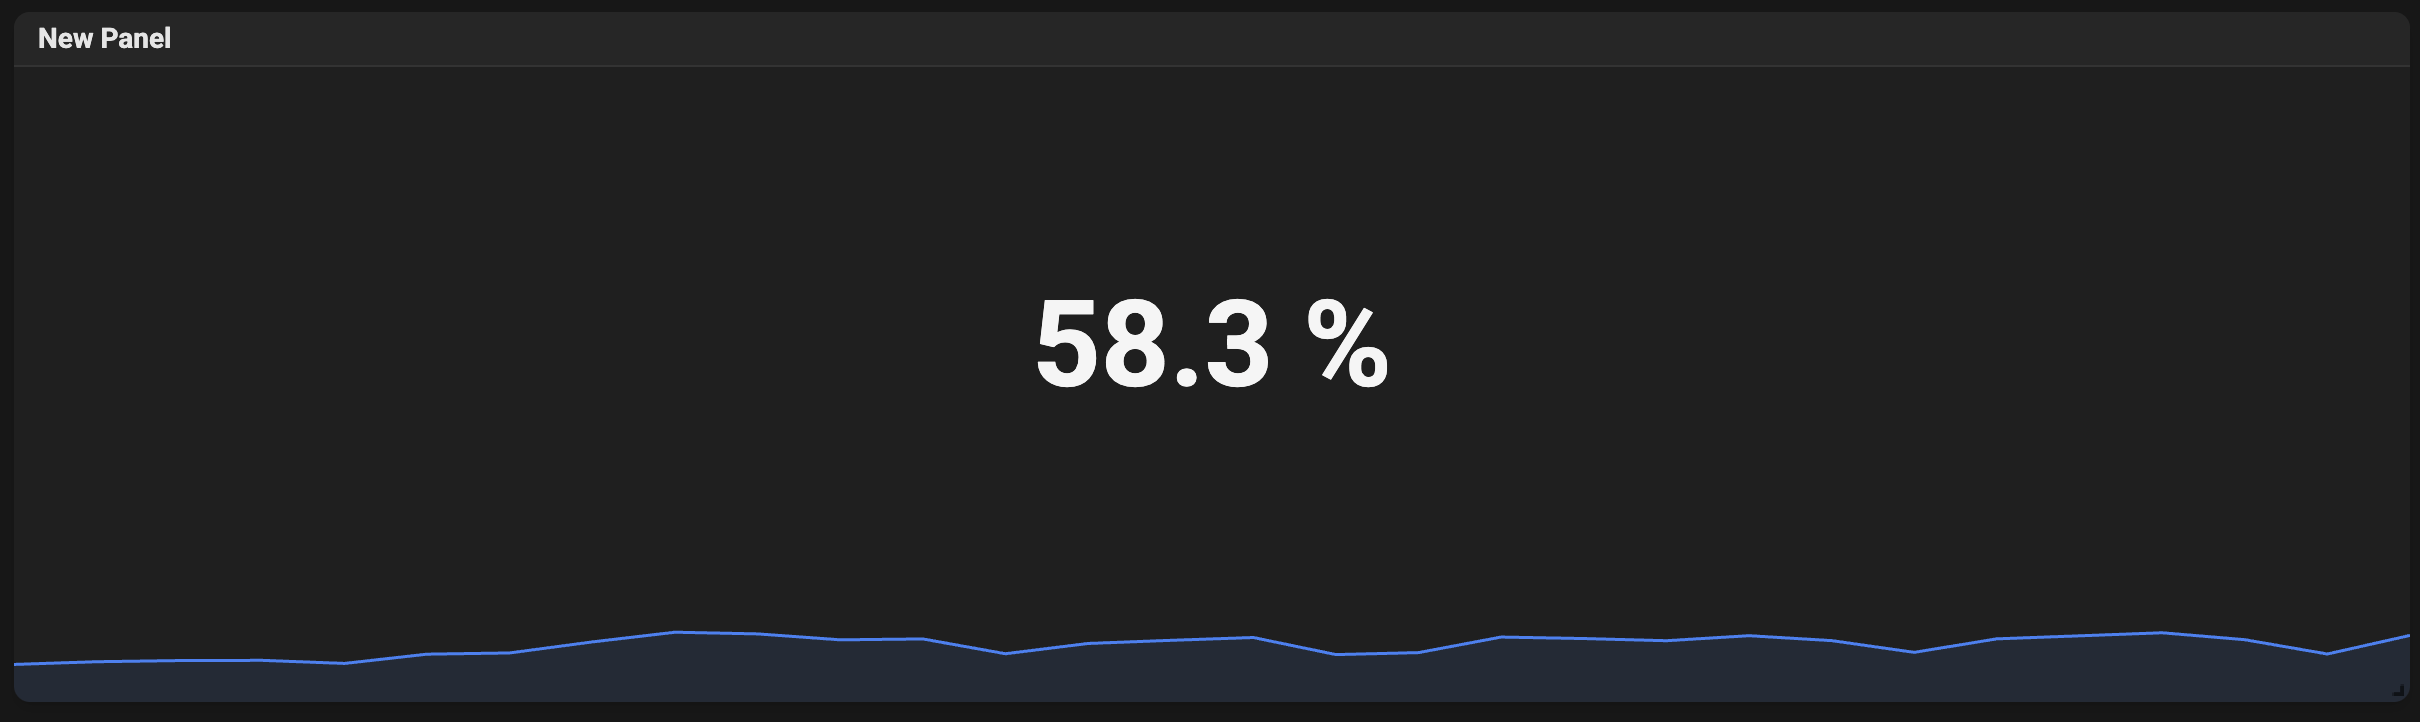
* A large single numeric value, optionally with a small sparkline showing a recent mini-trend. Useful for dashboards that need to display many KPIs compactly.
When to use it
* Show totals, averages, counts, or the latest reading for a metric when space is limited.
Interactions and info available
* Optional sparkline to hint at the short-term trend.
* Click or configure to change how the value is aggregated (latest, average, sum, etc.).
***
## Stat
What it shows
* A large single numeric value, optionally with a small sparkline showing a recent mini-trend. Useful for dashboards that need to display many KPIs compactly.
When to use it
* Show totals, averages, counts, or the latest reading for a metric when space is limited.
Interactions and info available
* Optional sparkline to hint at the short-term trend.
* Click or configure to change how the value is aggregated (latest, average, sum, etc.).
 ***
## Image
What it shows
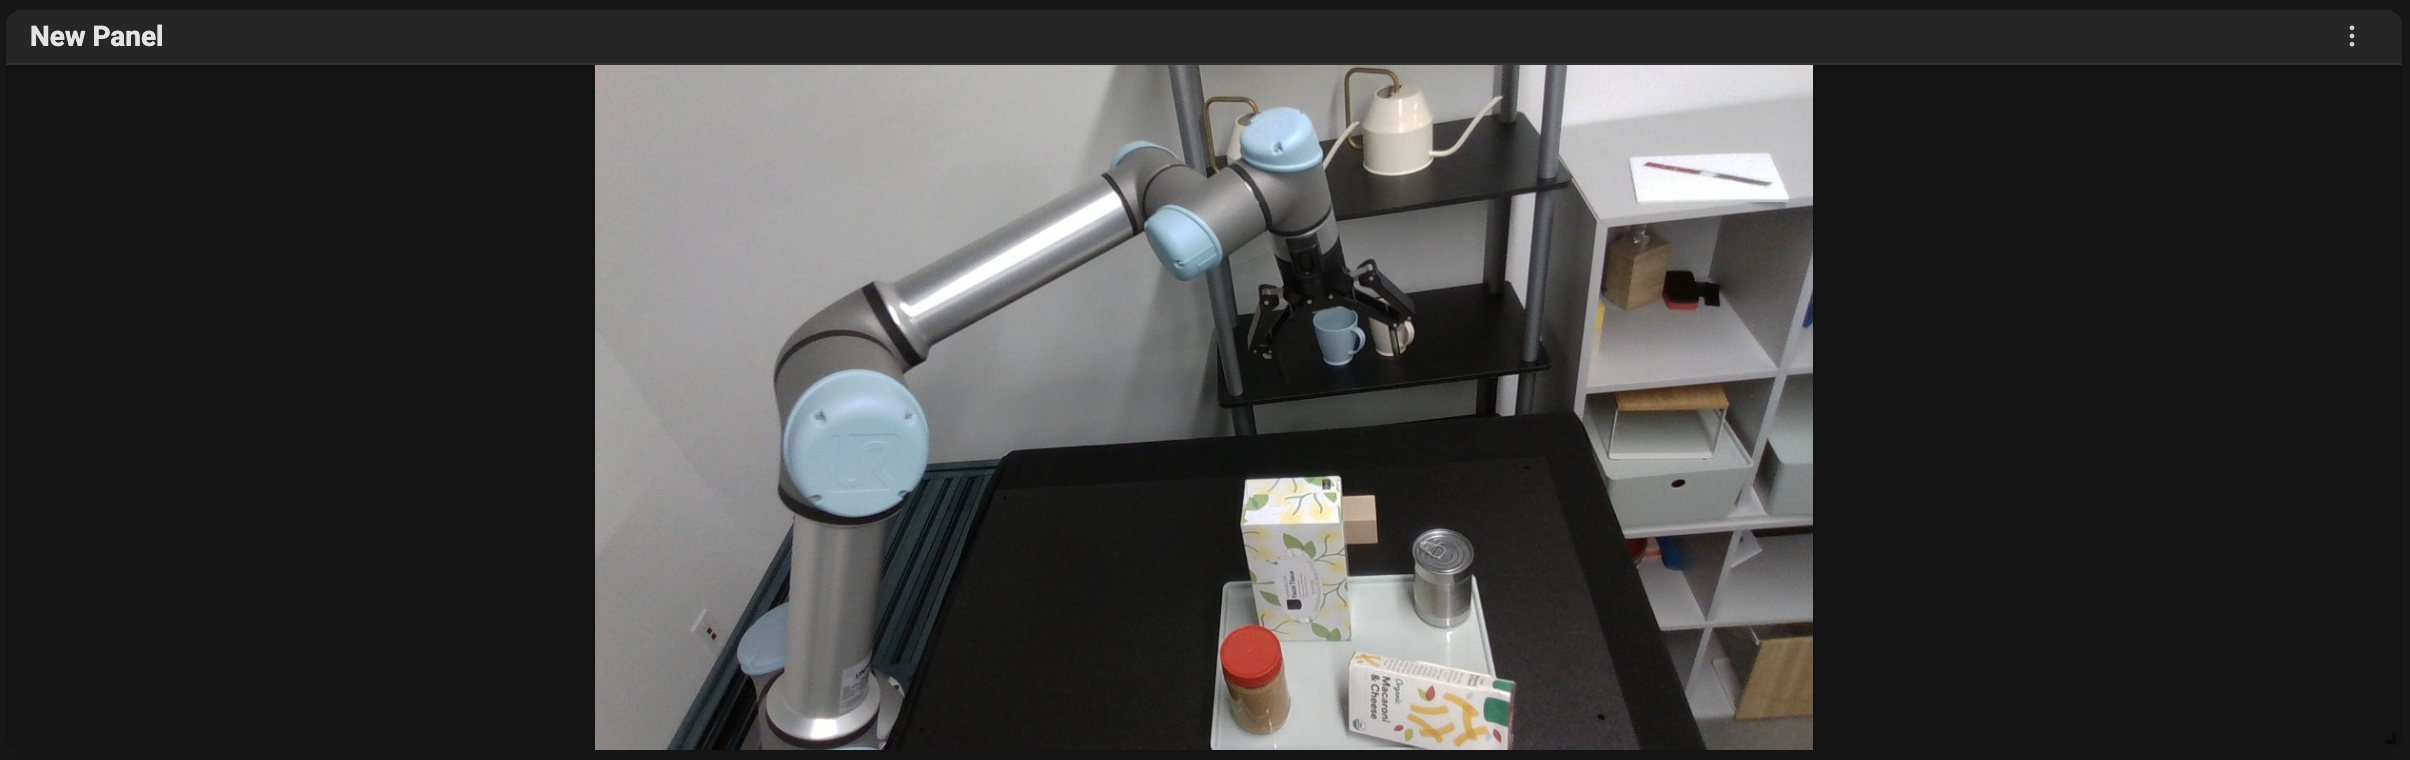
* An image pulled from a query (for example, a camera snapshot or an image stored as a metric). The panel shows the latest image for the selected time range.
When to use it
* Visual inspection tasks, camera feeds, or showing pictures associated with events.
Interactions and info available
* Configure which query supplies the image and the time range used to select the snapshot.
* If no image appears, verify the query is complete in the panel configuration.
***
## Image
What it shows
* An image pulled from a query (for example, a camera snapshot or an image stored as a metric). The panel shows the latest image for the selected time range.
When to use it
* Visual inspection tasks, camera feeds, or showing pictures associated with events.
Interactions and info available
* Configure which query supplies the image and the time range used to select the snapshot.
* If no image appears, verify the query is complete in the panel configuration.
 ***
## Host Map
What it shows
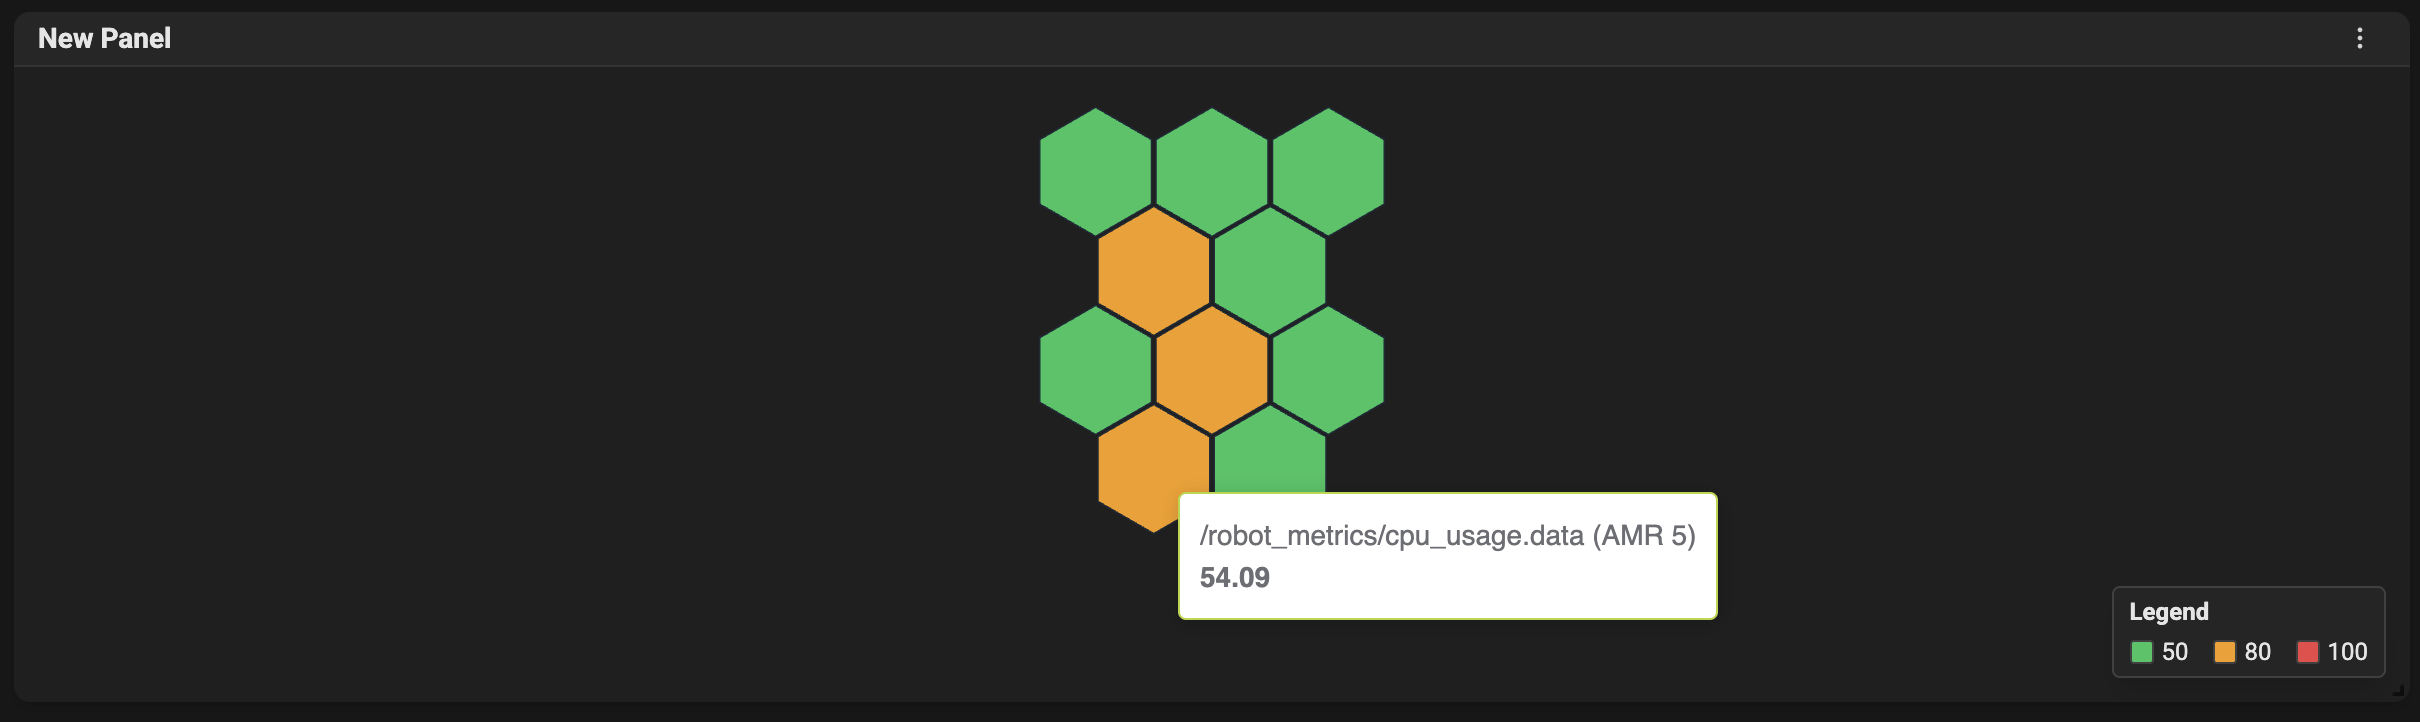
* A hexagonal (or grid) map of hosts/devices colored by a metric's value. Each tile represents a device or cluster, helping you spot hot/cold areas quickly.
When to use it
* Quickly identify groups of devices that are above or below thresholds (for example, many devices with high CPU or low battery in the same region).
Interactions and info available
* Hover tiles to see the device name and current value.
* Optional labels and cluster names can be toggled in the panel settings.
* Tile size and legend visibility are configurable.
***
## Host Map
What it shows
* A hexagonal (or grid) map of hosts/devices colored by a metric's value. Each tile represents a device or cluster, helping you spot hot/cold areas quickly.
When to use it
* Quickly identify groups of devices that are above or below thresholds (for example, many devices with high CPU or low battery in the same region).
Interactions and info available
* Hover tiles to see the device name and current value.
* Optional labels and cluster names can be toggled in the panel settings.
* Tile size and legend visibility are configurable.
 ***
## Map
What it shows
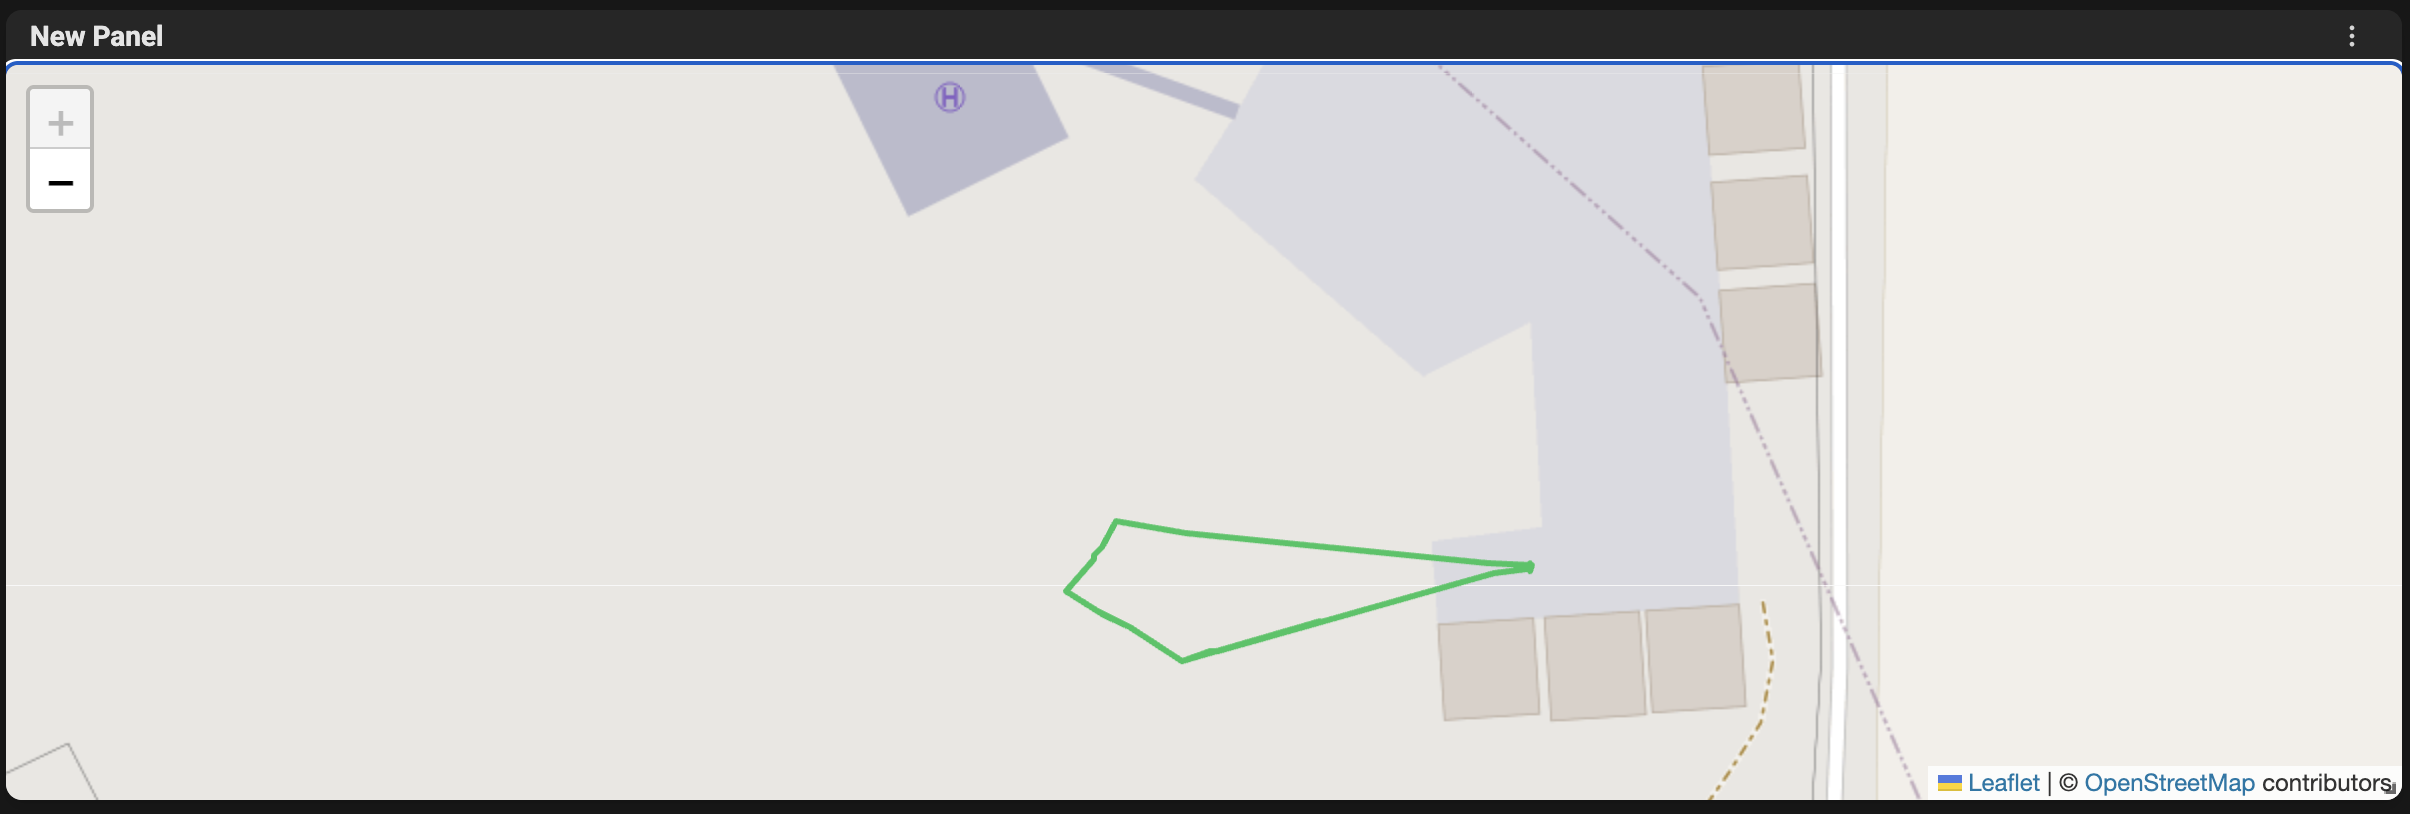
* Geographic or coordinate maps plotting positions from metrics (latitude/longitude) and optional labels. It can also render paths for moving devices.
When to use it
* Visualize locations and movement traces of devices, assets, or vehicles.
Interactions and info available
* Add at least two queries (latitude and longitude); an optional third query can provide labels.
* Pan, zoom, and inspect individual points. Paths can be rendered in the latest or full-mode depending on configuration.
***
## Map
What it shows
* Geographic or coordinate maps plotting positions from metrics (latitude/longitude) and optional labels. It can also render paths for moving devices.
When to use it
* Visualize locations and movement traces of devices, assets, or vehicles.
Interactions and info available
* Add at least two queries (latitude and longitude); an optional third query can provide labels.
* Pan, zoom, and inspect individual points. Paths can be rendered in the latest or full-mode depending on configuration.
 ***
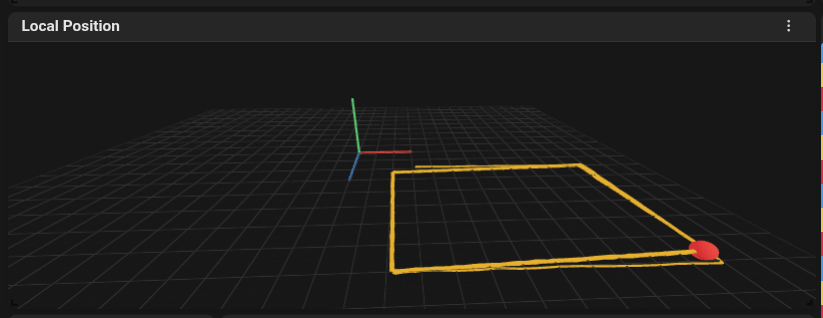
## 3D Scene
What it shows
* A 3D visualization of points, paths, or simple scenes derived from up to three numeric series (commonly X/Y/Z coordinates).
When to use it
* Explore spatial data when a flat map is not enough—for example, altitude-aware paths or simple 3D position traces.
Interactions and info available
* Rotate, pan, and zoom the scene to inspect trajectories and points.
* Display a latest marker to highlight the most recent position.
***
## 3D Scene
What it shows
* A 3D visualization of points, paths, or simple scenes derived from up to three numeric series (commonly X/Y/Z coordinates).
When to use it
* Explore spatial data when a flat map is not enough—for example, altitude-aware paths or simple 3D position traces.
Interactions and info available
* Rotate, pan, and zoom the scene to inspect trajectories and points.
* Display a latest marker to highlight the most recent position.
 ***
## Tips for choosing the right visualization
* Use Timeseries for trends and multi-series comparison.
* Use Gauge or Stat for single high-priority KPIs that should be visible at a glance.
* Use Map or Host Map for spatial information and clustering.
* Use Logs when you need to inspect textual events instead of numeric metrics.
If you're unsure, start with a Timeseries or Stat panel and adjust to Gauge or Map once you know which single value or spatial relationship you need to highlight.
***
***
## Tips for choosing the right visualization
* Use Timeseries for trends and multi-series comparison.
* Use Gauge or Stat for single high-priority KPIs that should be visible at a glance.
* Use Map or Host Map for spatial information and clustering.
* Use Logs when you need to inspect textual events instead of numeric metrics.
If you're unsure, start with a Timeseries or Stat panel and adjust to Gauge or Map once you know which single value or spatial relationship you need to highlight.
***