Incident History
The Incident History page gives you a clear, chronological view of incidents raised by your alarm rules. It’s designed to help you triage issues quickly, see which alarms are most active, and find the context you need to resolve problems.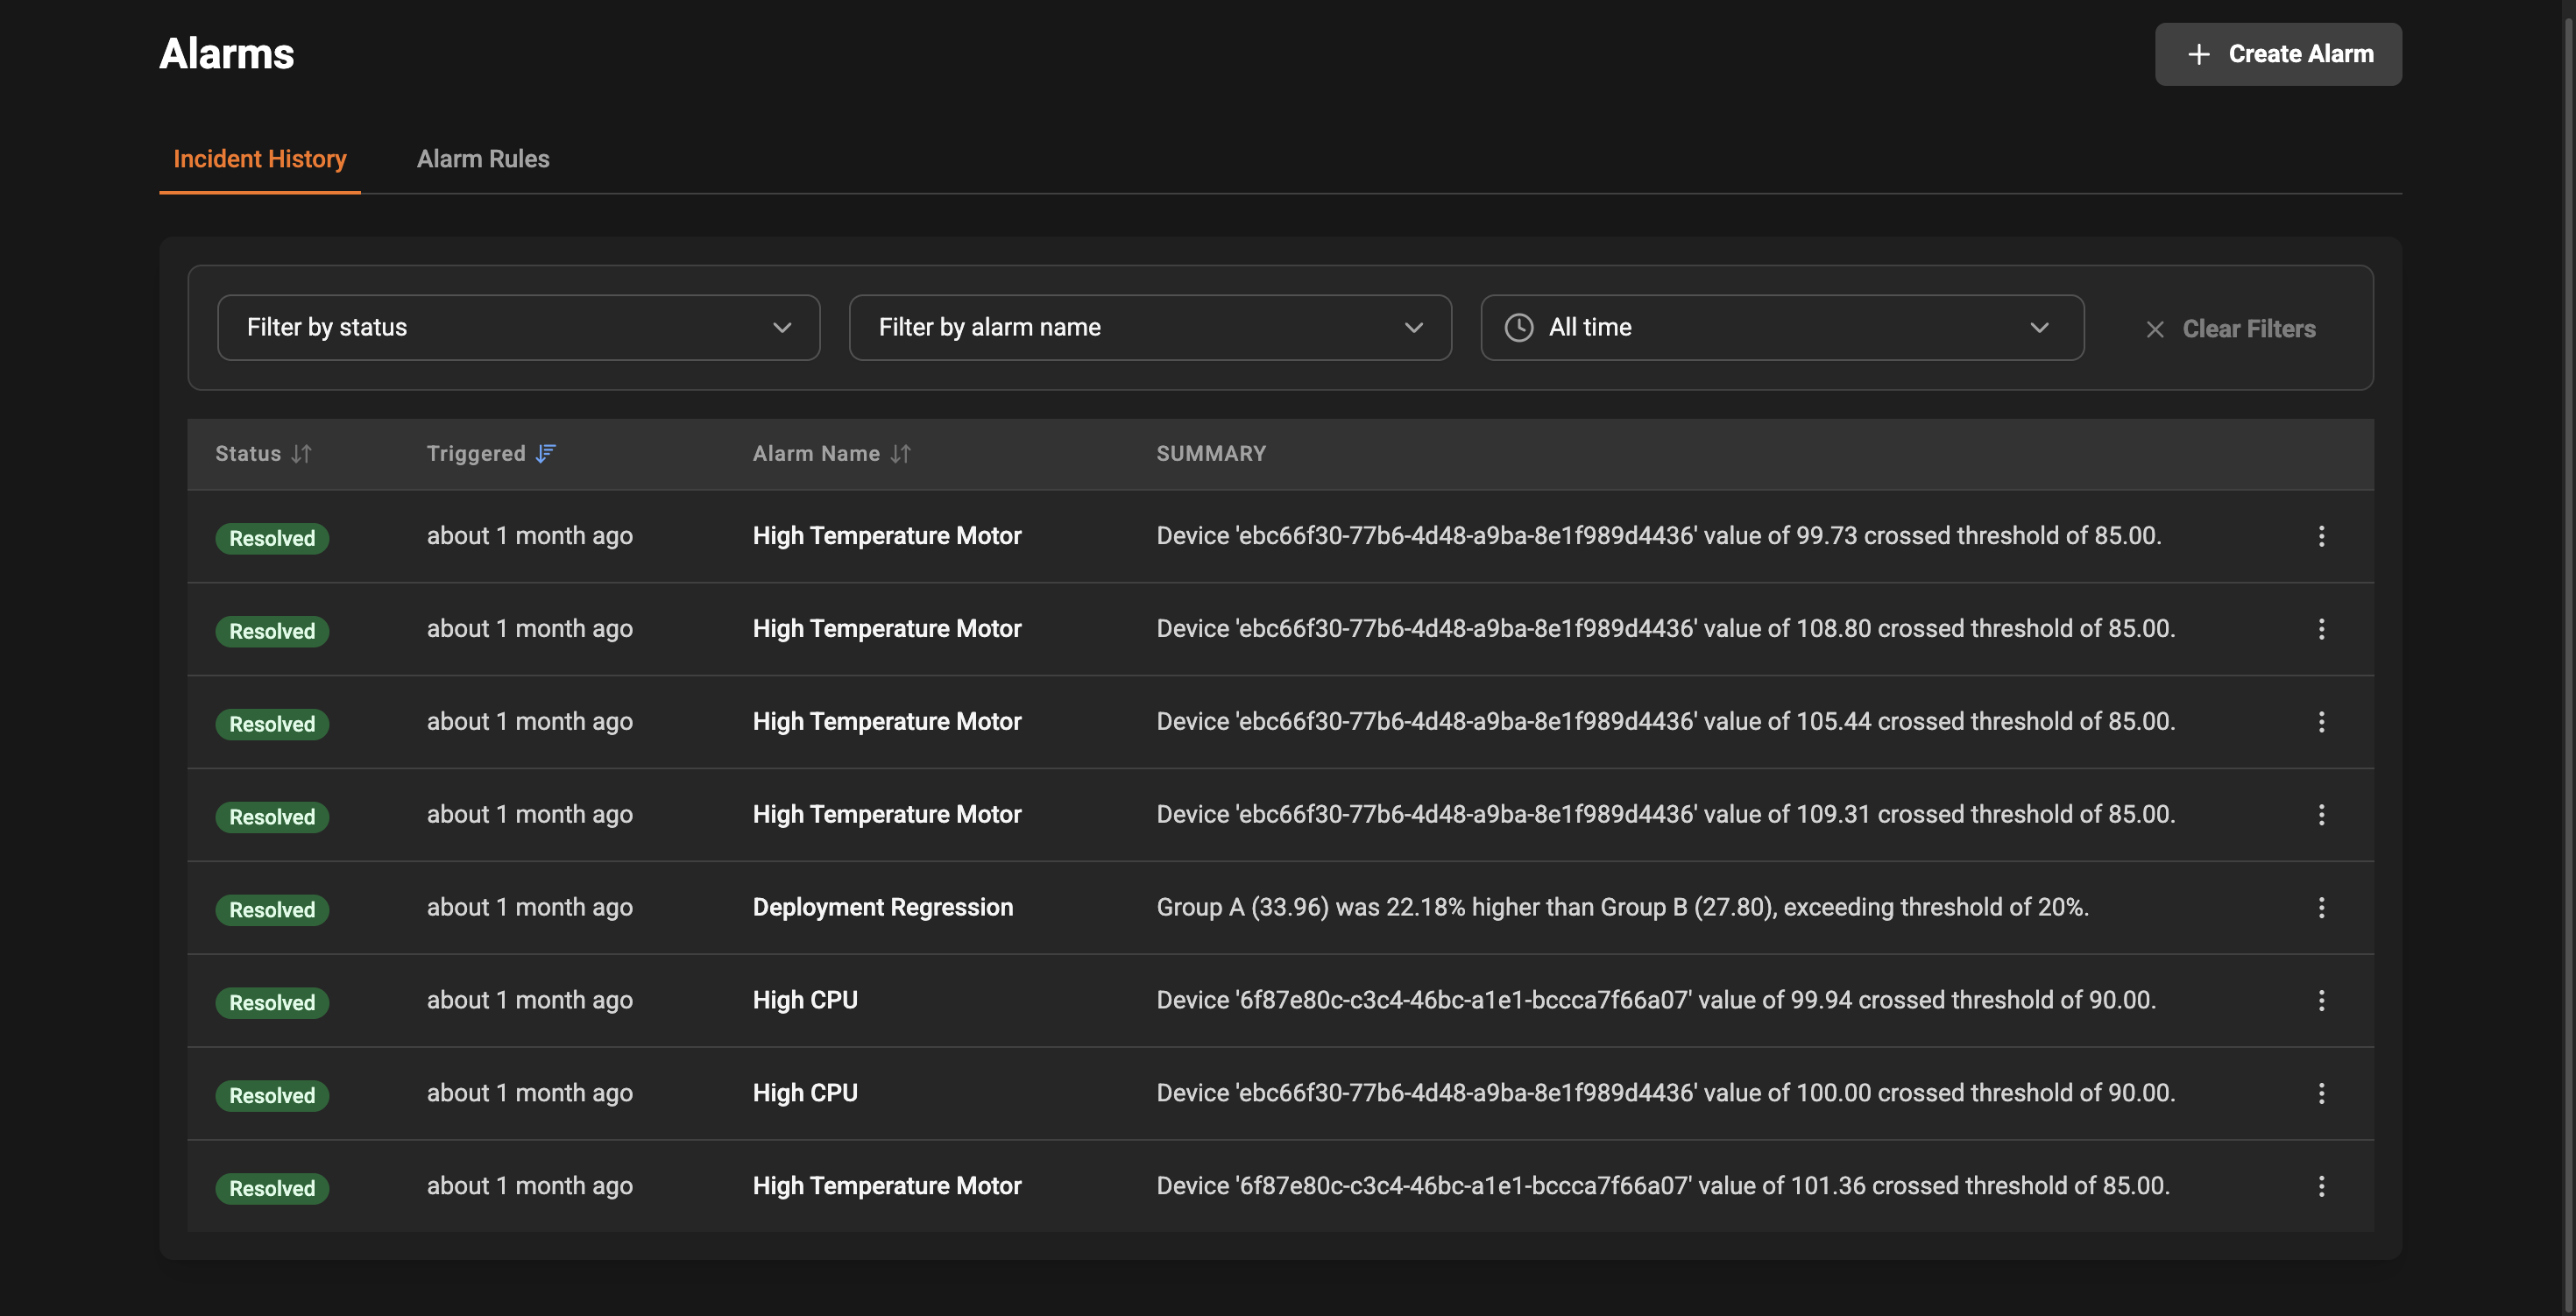
At-a-glance information
Each row in the incident list shows the most relevant details so you can quickly scan and prioritize:- Status: The current lifecycle of the incident (Open, Acknowledged, Resolved). Color-coded badges make it easy to spot urgent items.
- Triggered: A human-friendly time indicator (e.g., “5 minutes ago”) with the exact timestamp available on hover.
- Alarm Name: Which alarm rule created the incident, so you know what condition was met.
- Summary: A short description of why the incident fired to help you triage faster.
Filters and time ranges
Use the controls above the list to narrow the incidents shown:- Status filter: Show only Open, Acknowledged, or Resolved incidents.
- Alarm filter: Limit the list to incidents from a specific alarm rule.
- Time range picker: Focus on recent events or look back over a custom period.

Sorting and pagination
You can sort the list by status, triggered time, or alarm name using the column headers. Results are paginated so you can step through large sets of incidents. Use the page controls at the bottom of the list to move between pages.Analysis
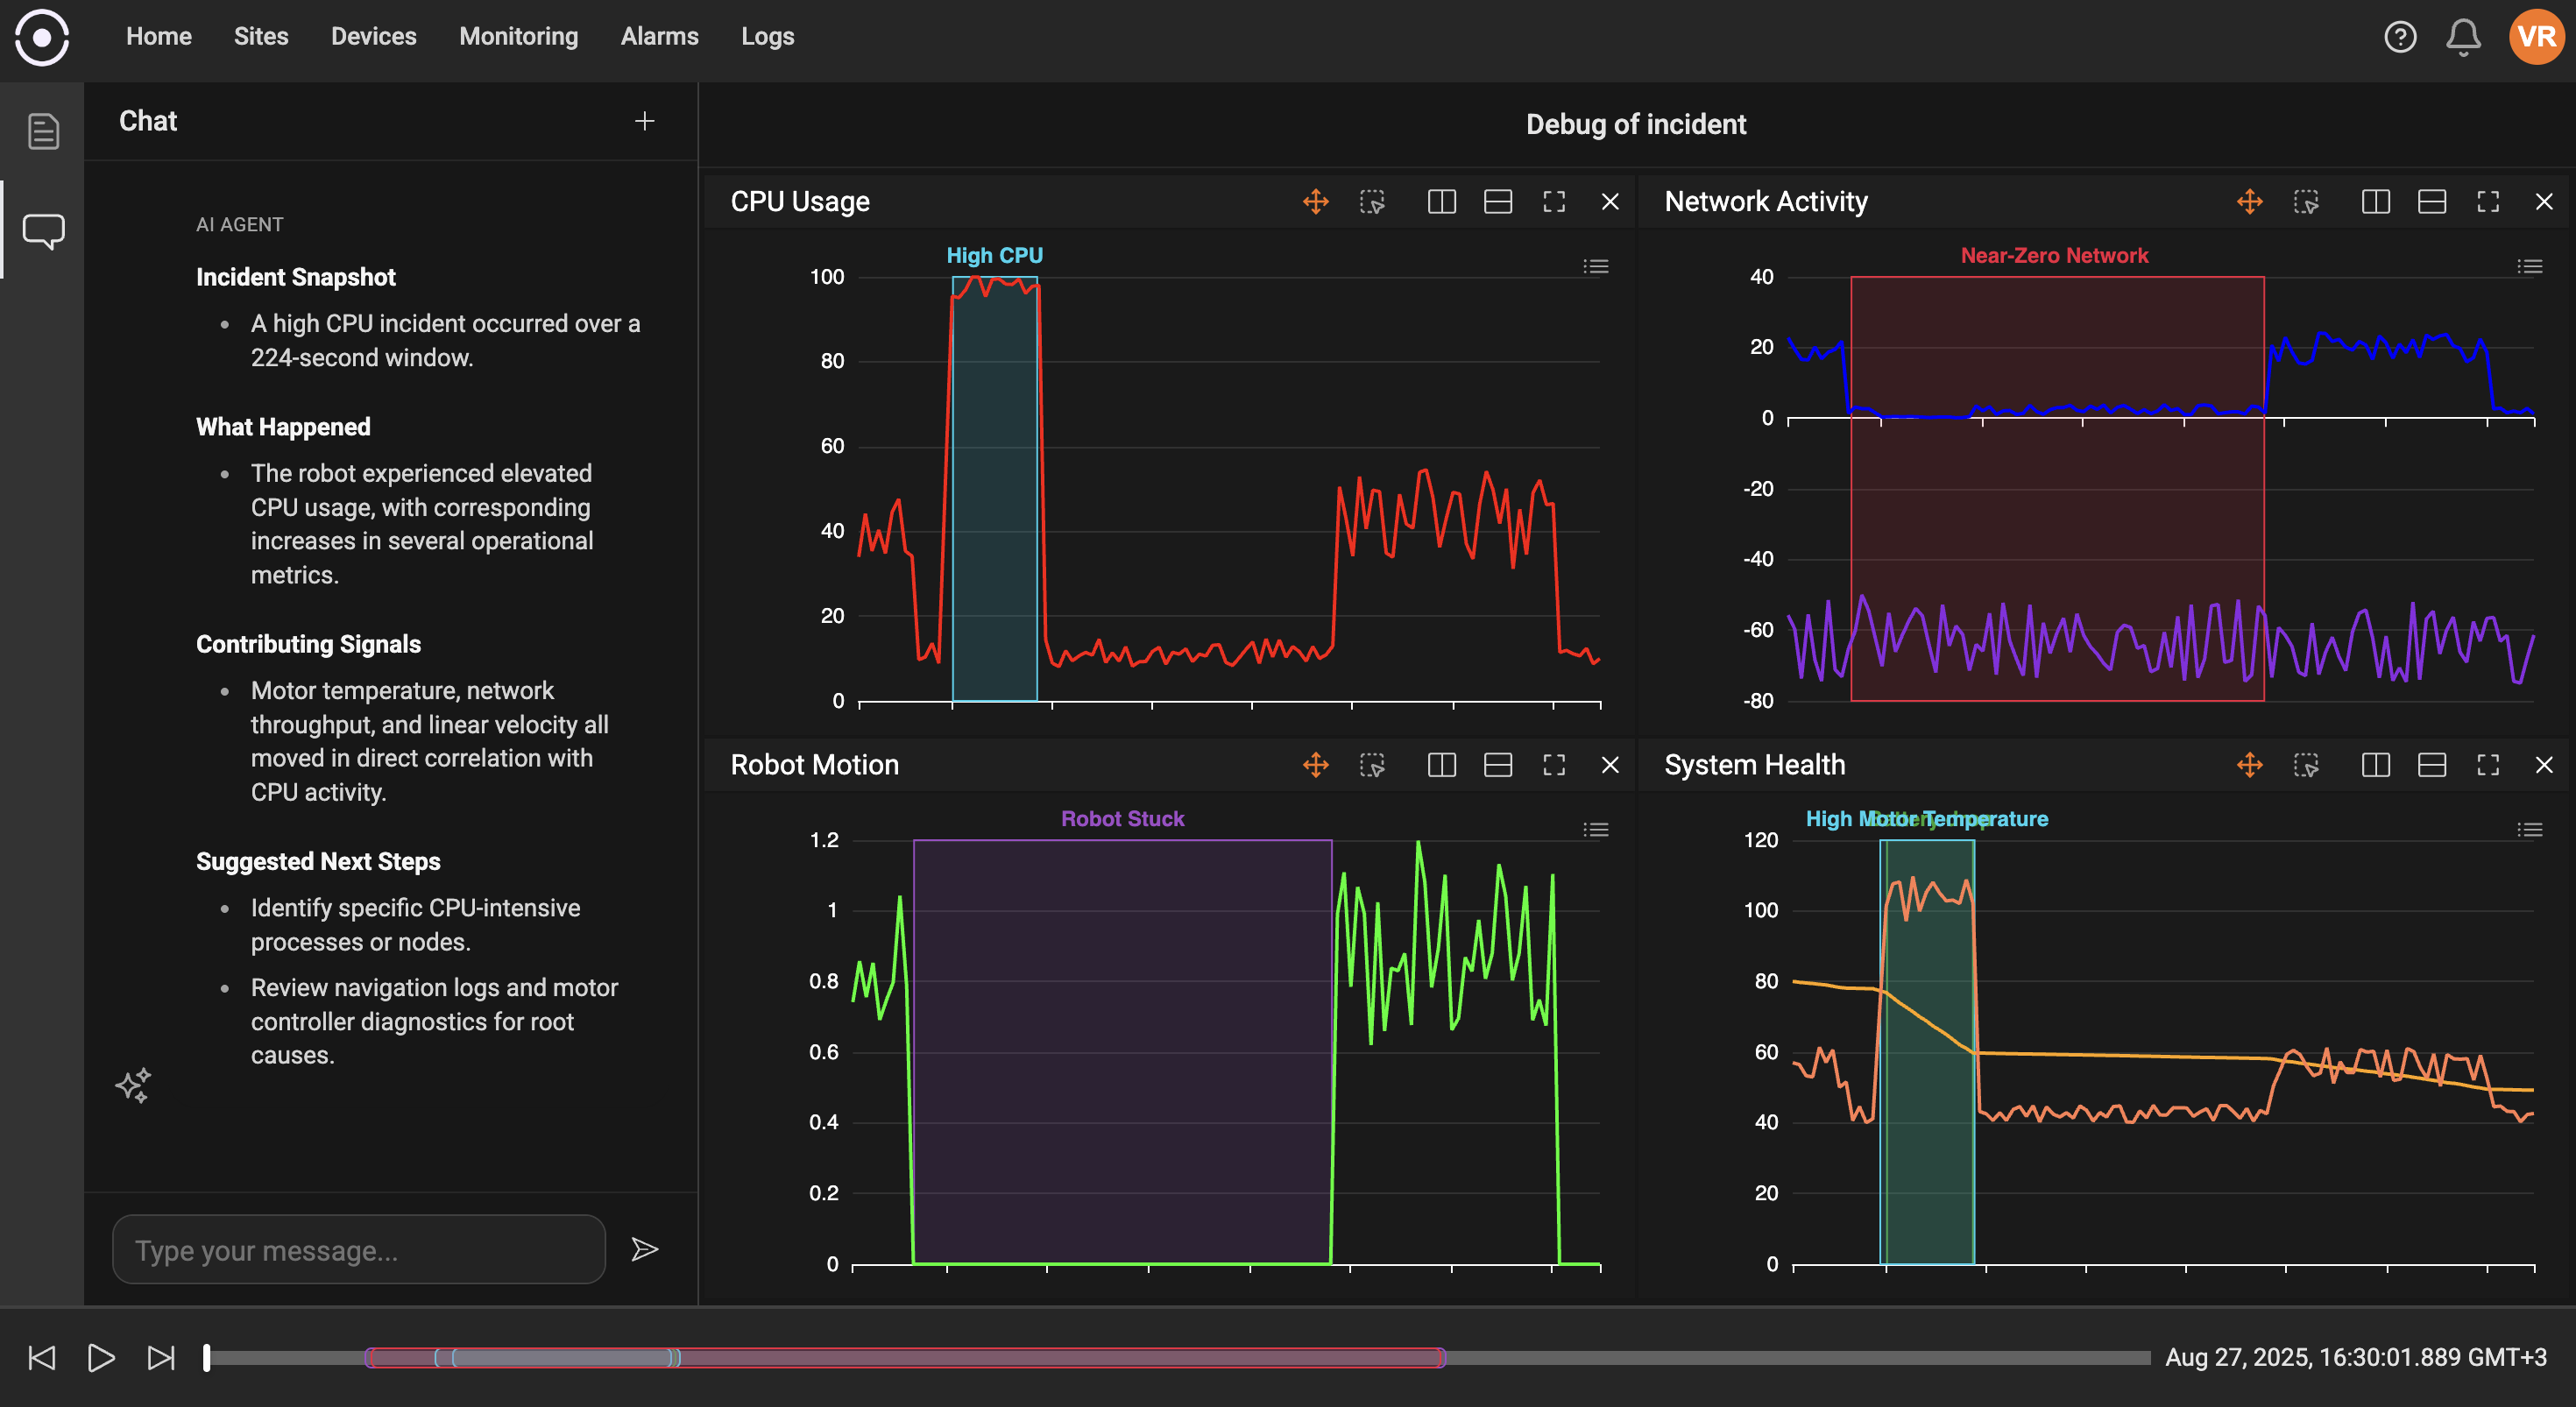
Click the action menu (three-dot button) on an incident to access quick actions such as:- Open in Debugger: Launch a debugging or analysis session preloaded with the incident context to investigate root causes.
Best practices
- Triage Open incidents first — these indicate active conditions that may need immediate attention.
- Acknowledge incidents you’re investigating so teammates know someone is working on them.
- Resolve incidents after the problem is fixed to keep the list focused on ongoing issues.
Troubleshooting tips
- If expected incidents do not appear, confirm the alarm rule is enabled and that the time range or status filters do not exclude the event.
- Use the alarm name to jump back to the rule definition if you need to adjust thresholds or scope.