Tabs
- Incident History: A chronological list of incidents triggered by alarm rules. Use this view to investigate what happened, when, and which alarm triggered.
- Alarm Rules: A list of the configured alarm rules. From here you can create new alarms, edit existing ones, enable/disable them, or delete rules you no longer need.
Key UI elements
- Create Alarm: Click the “Create Alarm” button to open the alarm form and add a new rule. The form walks you through naming the alarm, describing it, and defining the condition that triggers it.
- Tabs (Incident History / Alarm Rules): Switch between views using the tabs at the top. The app remembers your last selected tab so you can pick up where you left off.
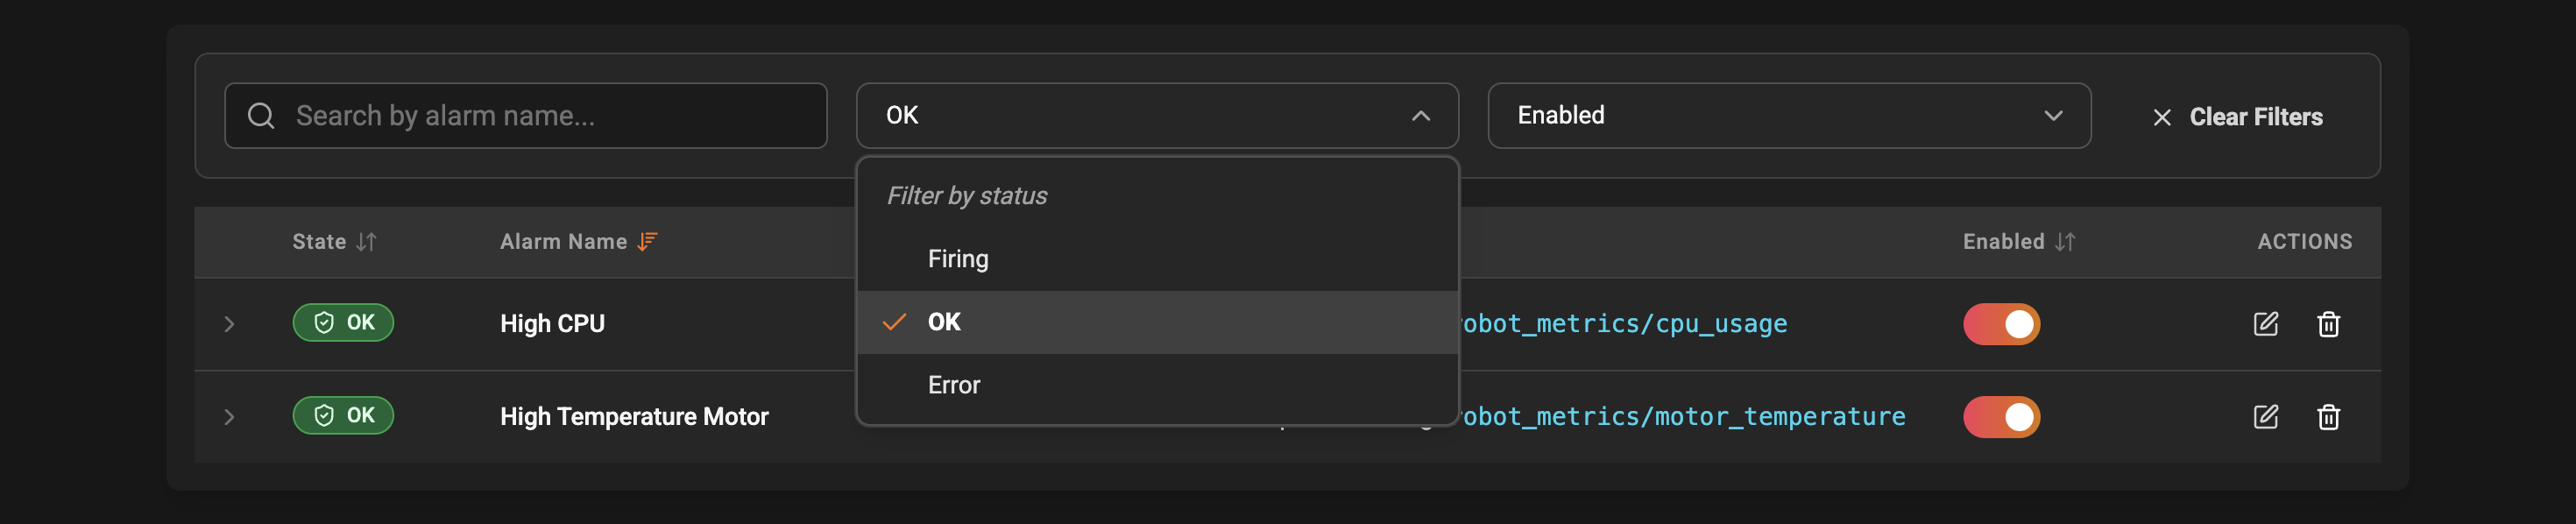
- Filters: Use the filter controls to narrow down the list by name, status, enabled state, alarm ID, and time range (for incidents). Filters are reflected in the page URL so you can share or bookmark specific views.
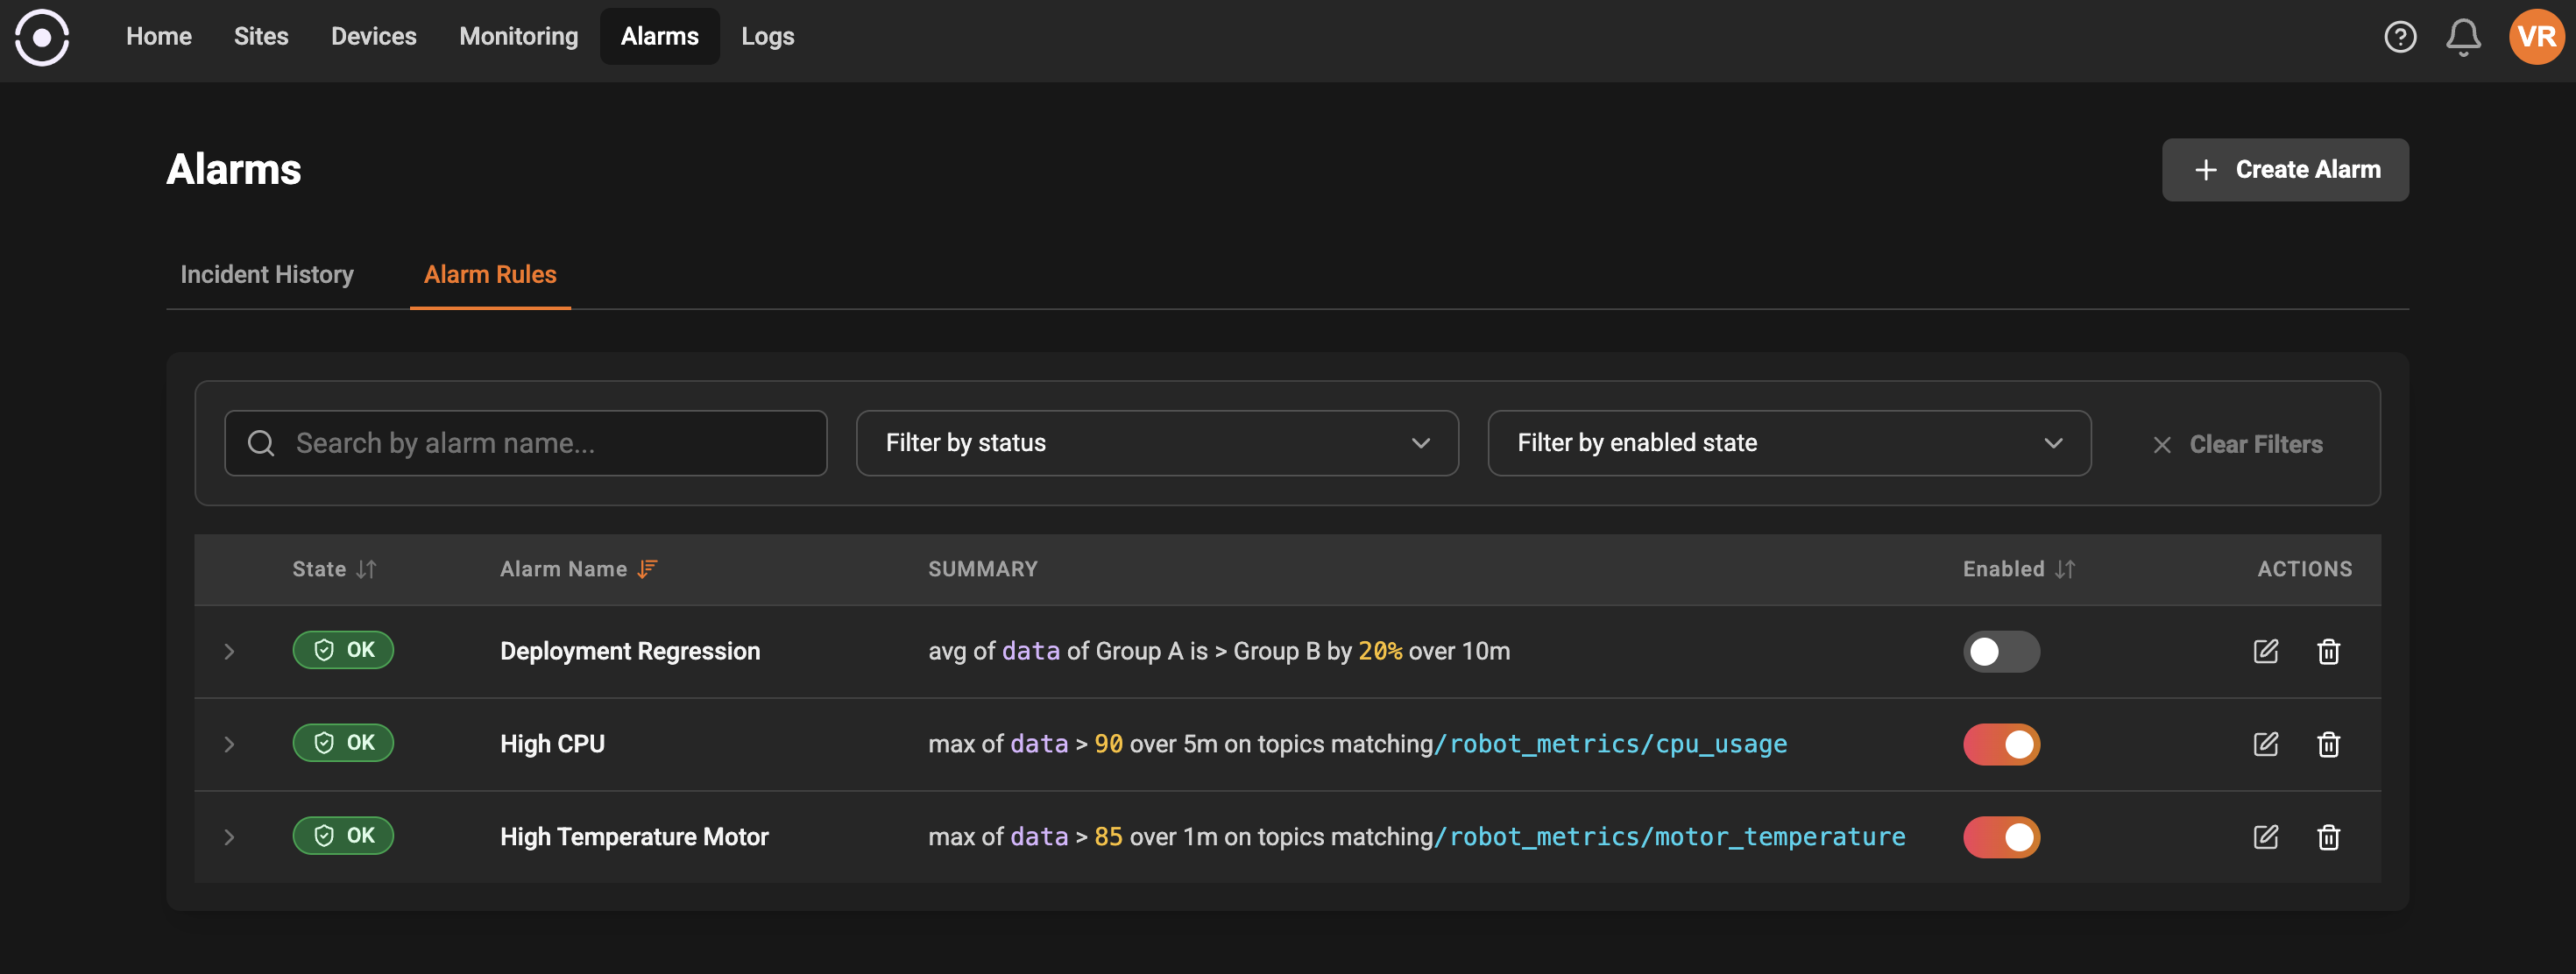
Alarm Rules view
In the Alarm Rules tab you will see a table of all alarm rules. Each row shows:- State: Live health of the alarm (e.g., Firing, OK, Error).
- Alarm Name: The friendly name you gave the rule.
- Summary: A short, readable explanation of the rule condition so you can quickly understand what it watches.
- Enabled: A toggle to enable or pause the alarm without deleting it.
- Actions: Quick actions to edit or delete the rule.
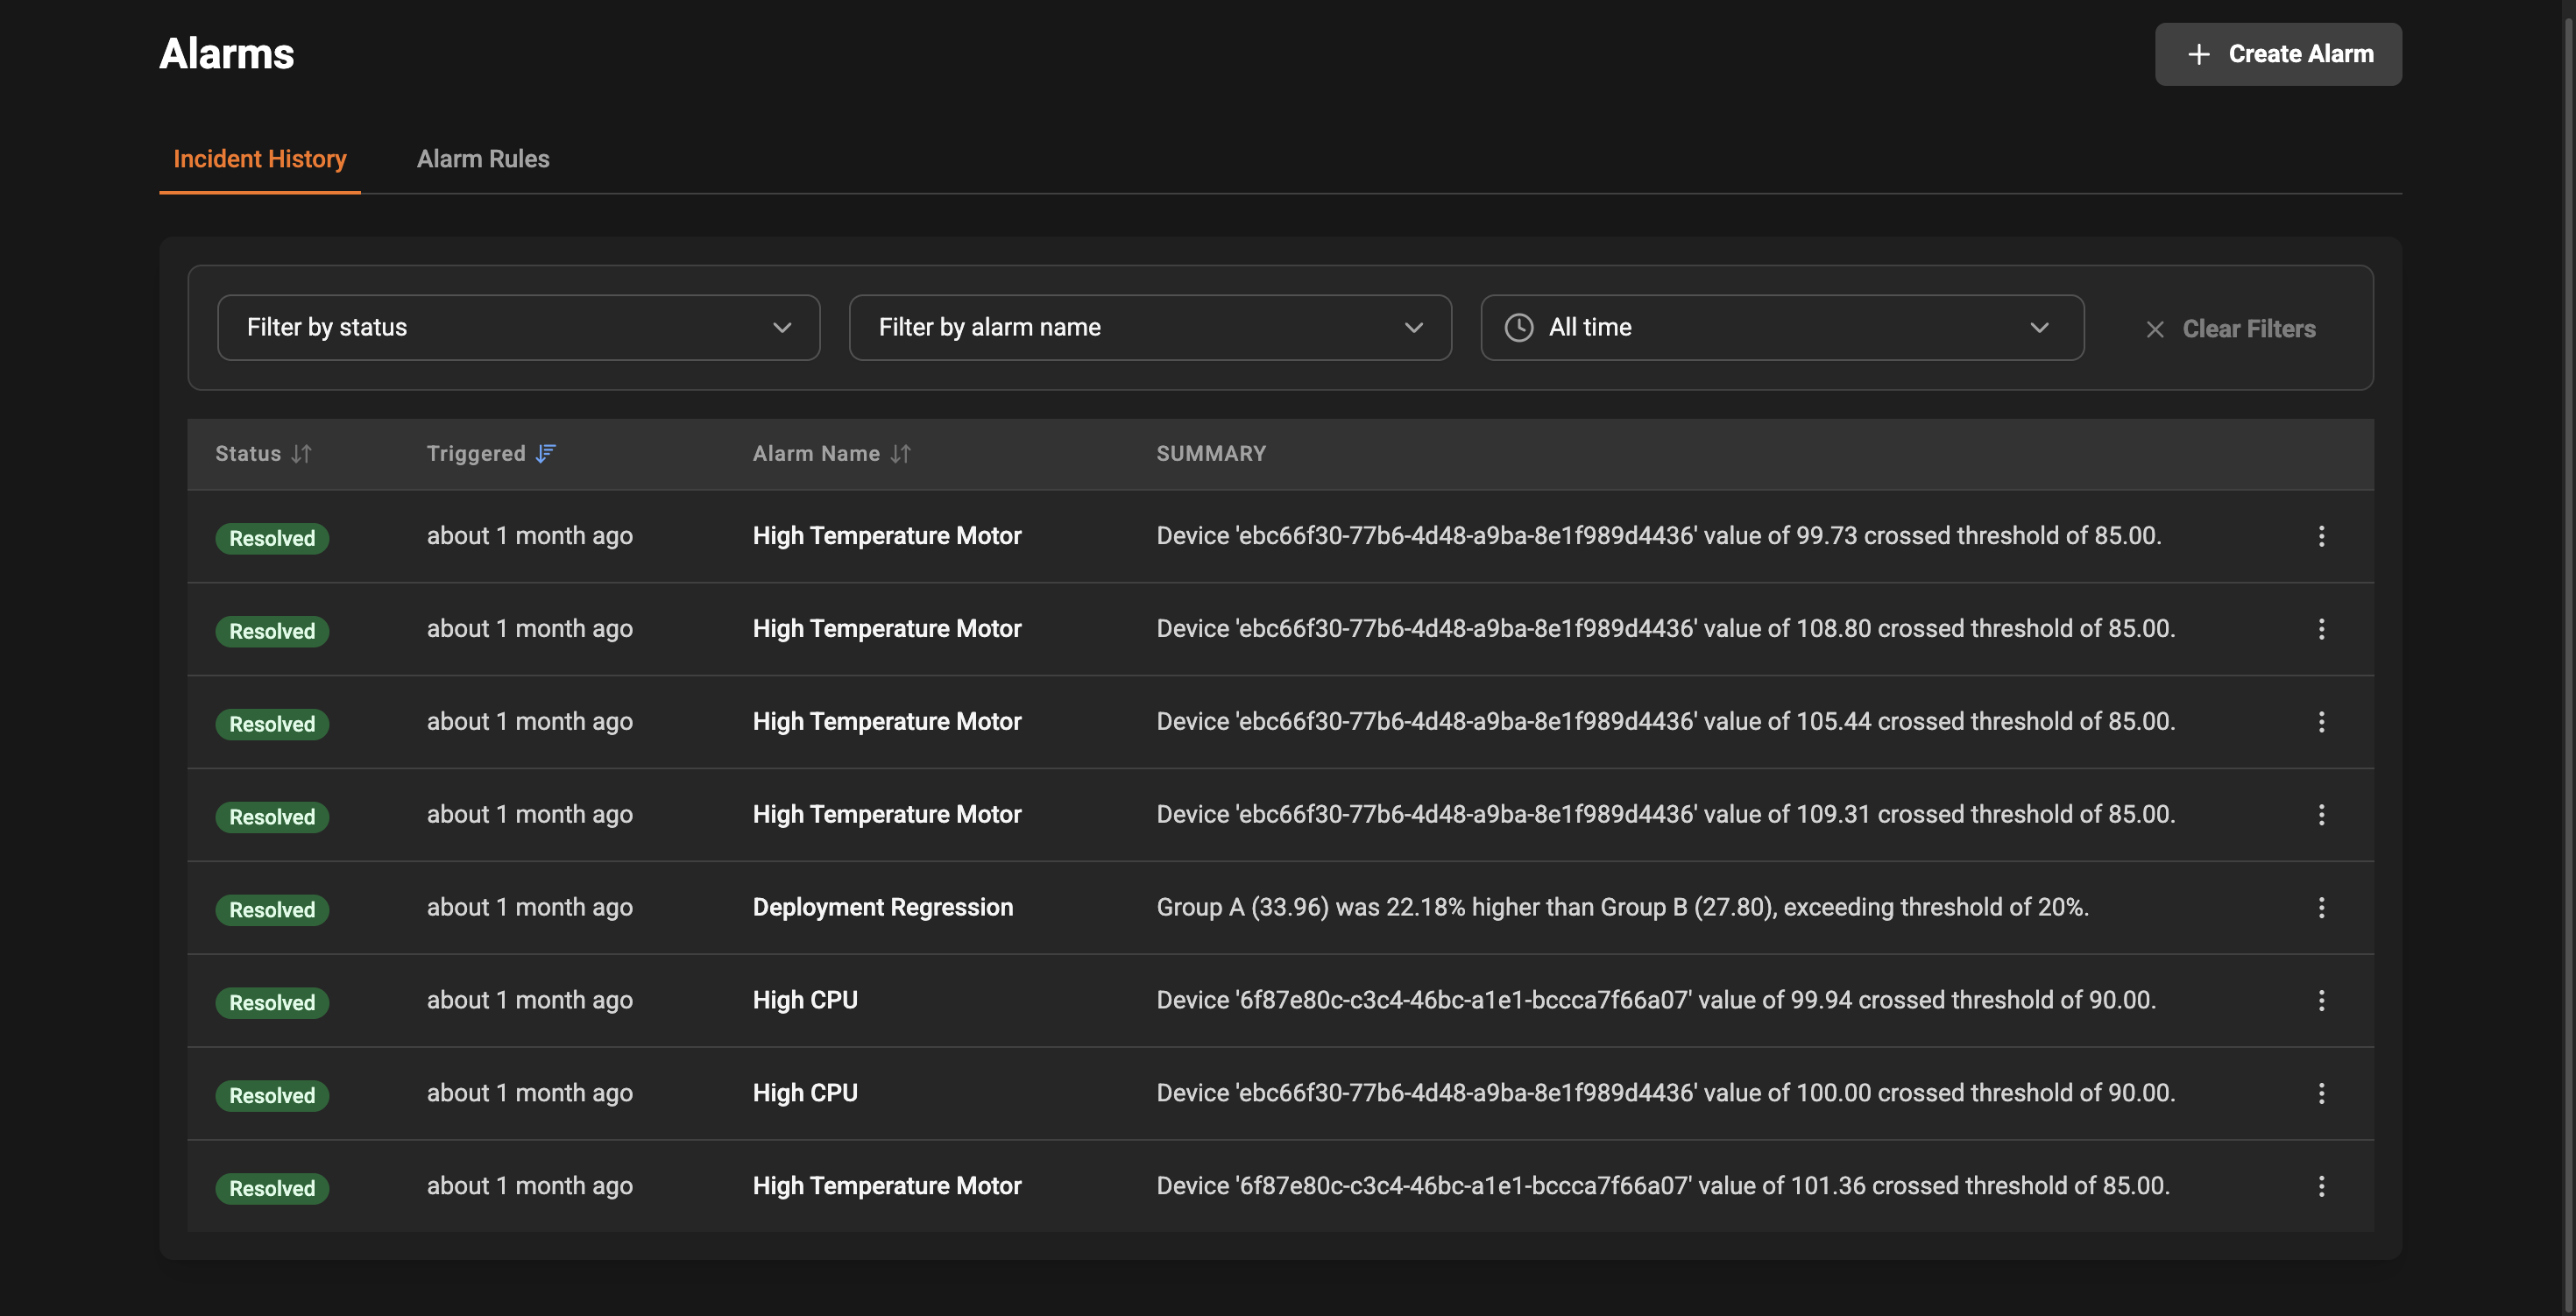
Incident History view
The Incident History tab lists incidents raised by alarm rules. For each incident you can typically see:- When the incident occurred and when it was last checked.
- Which alarm rule triggered the incident.
- The current state of the incident (open, resolved, etc.).
- Context and details about why it fired so you can triage the issue quickly.
Tips for effective use
- Give alarms clear, actionable names and include a description so team members know what to do when they see an incident.
- Use device metadata filters to target only relevant devices and reduce noise.
- When testing a new rule, consider leaving it disabled or setting a conservative threshold until you’ve validated it.
Troubleshooting and next steps
- If an expected alarm does not appear in Incident History, check that the rule is enabled and that the condition matches the expected data path and values.
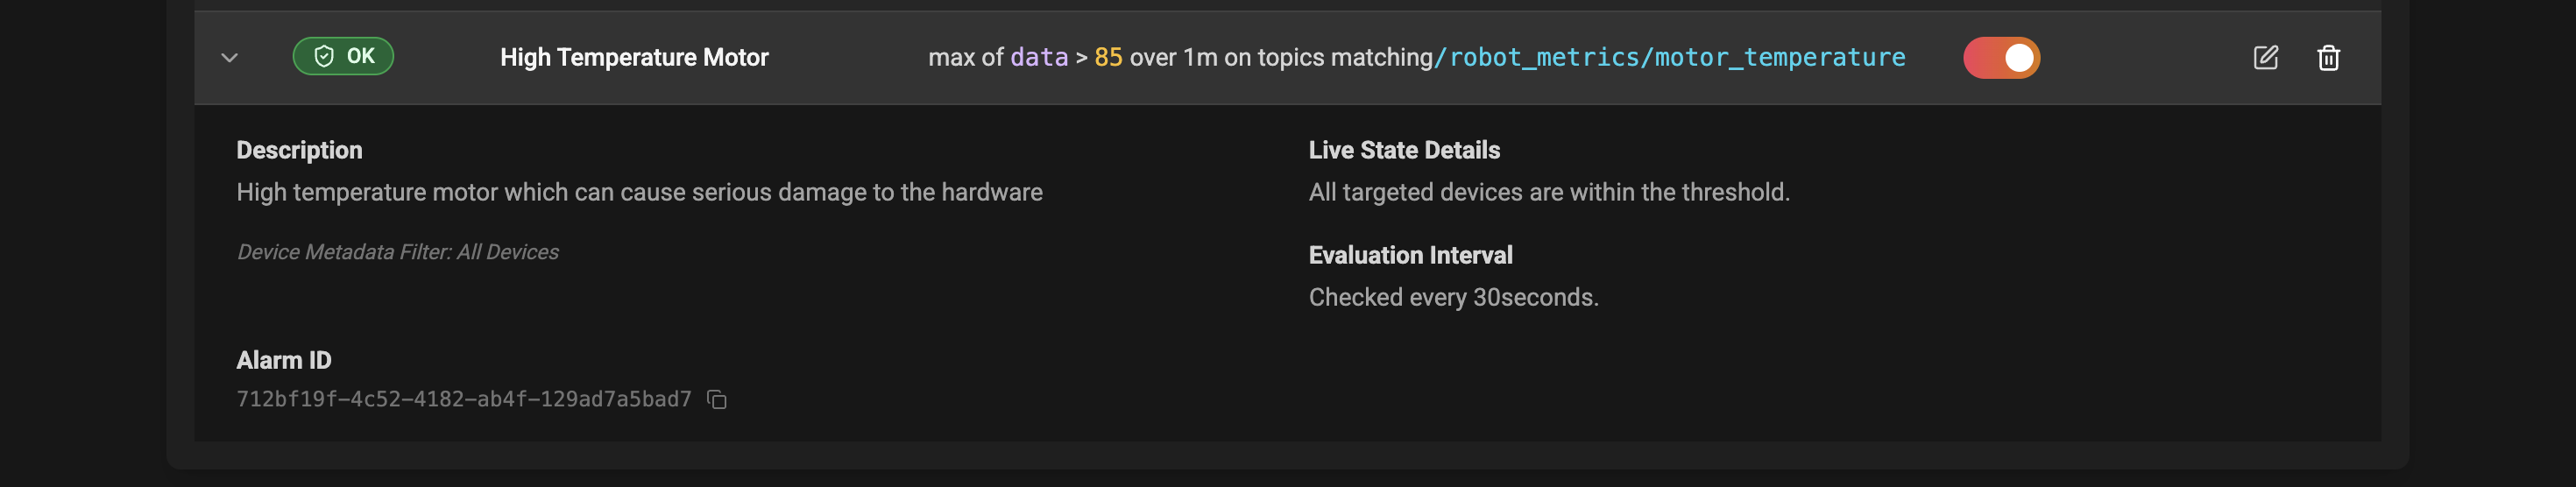
- Use the alarm ID (copyable from the expanded view) when discussing a rule with your team or support.