At a glance
When you open a device’s config tab you’ll find:- The device header with the device name, type (if any), Site (if any), a live status indicator (Online / Offline) and a description.
- Sources discovered automatically from the device (Host metrics and ROS2).
- Device Metadata for easy identification and search.
Status indicator
The status badge on the device header shows whether the device is currently online or offline. This status refreshes automatically so you can see near-real-time connectivity without reloading the page.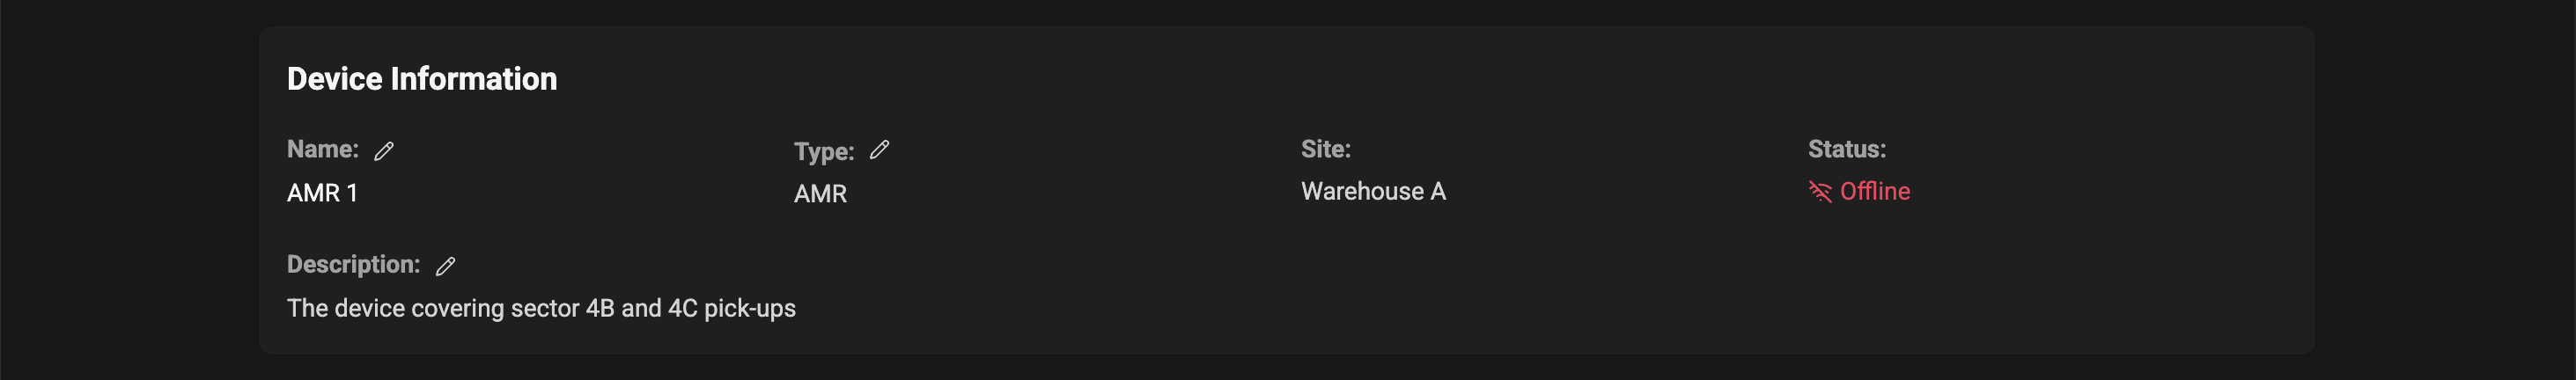
- Check the device’s network and power.
- If problems persist, see the Troubleshooting section below or contact your administrator.
Sources
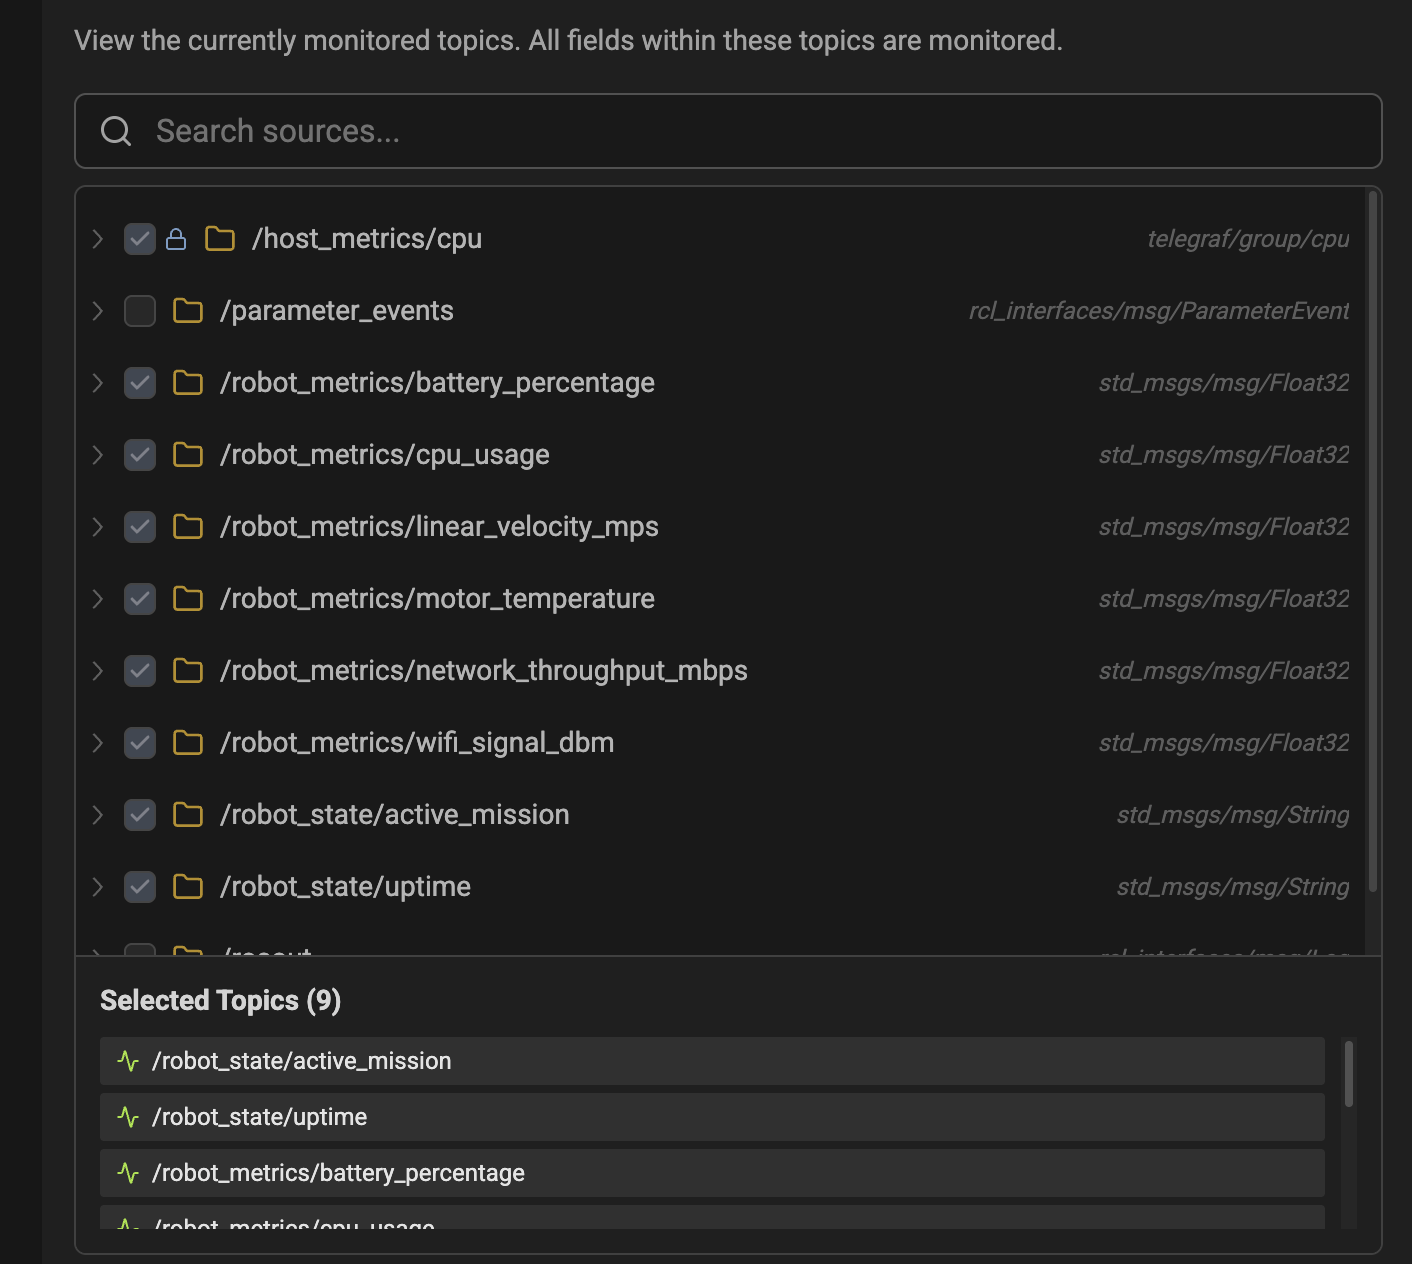
The Sources section lists data sources that the agent has discovered on the device. This typically includes:- Host metrics: CPU, memory, disk, and network usage from the device’s operating system. This are always collected by the agent once it’s running.
- ROS2: If the device is running ROS2 and the agent has detected it, it will show up here with details about the ROS2 topics being monitored.
Metadata
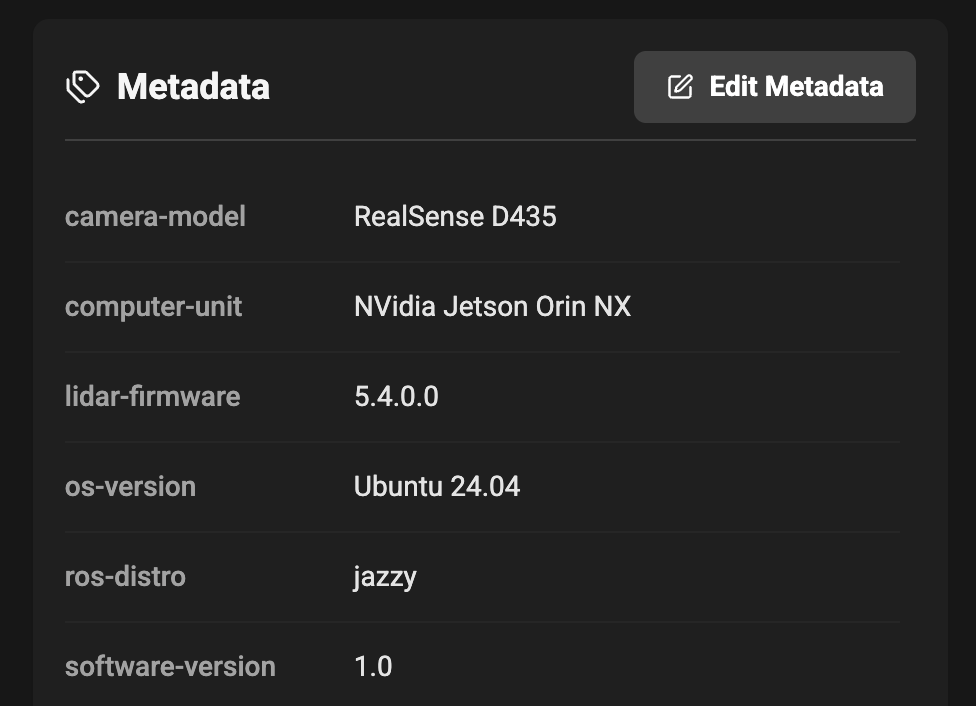
The Metadata section allows you to add custom key-value pairs to help identify and organize devices. Common metadata includes:- Software versions
- Hardware serial numbers
- Firmware versions
- Hardware models
Best practices
- Give devices meaningful names (ID + role, e.g. “AMR Sector 4B”) so they are easy to find.
- Add a short description with installation notes (mounting location, contacts, or serial numbers).
- Complete the setup right after provisioning devices to avoid confusion in dashboards or alerts.
Rolling Buffer (MCAP Recording)
The Rolling Buffer lets you automatically record and temporarily store recent data from your device, using the MCAP format. This is especially useful for troubleshooting, compliance, or capturing important events for later upload or analysis.What is the Rolling Buffer?
- The Rolling Buffer stores a configurable amount of recent data on the device, automatically overwriting the oldest data when the storage limit is reached (FIFO mode).
- You can adjust the storage size, retention policy, and which data streams (pipelines/topics) are recorded.
- Data is split into manageable files for reliability and easier upload.
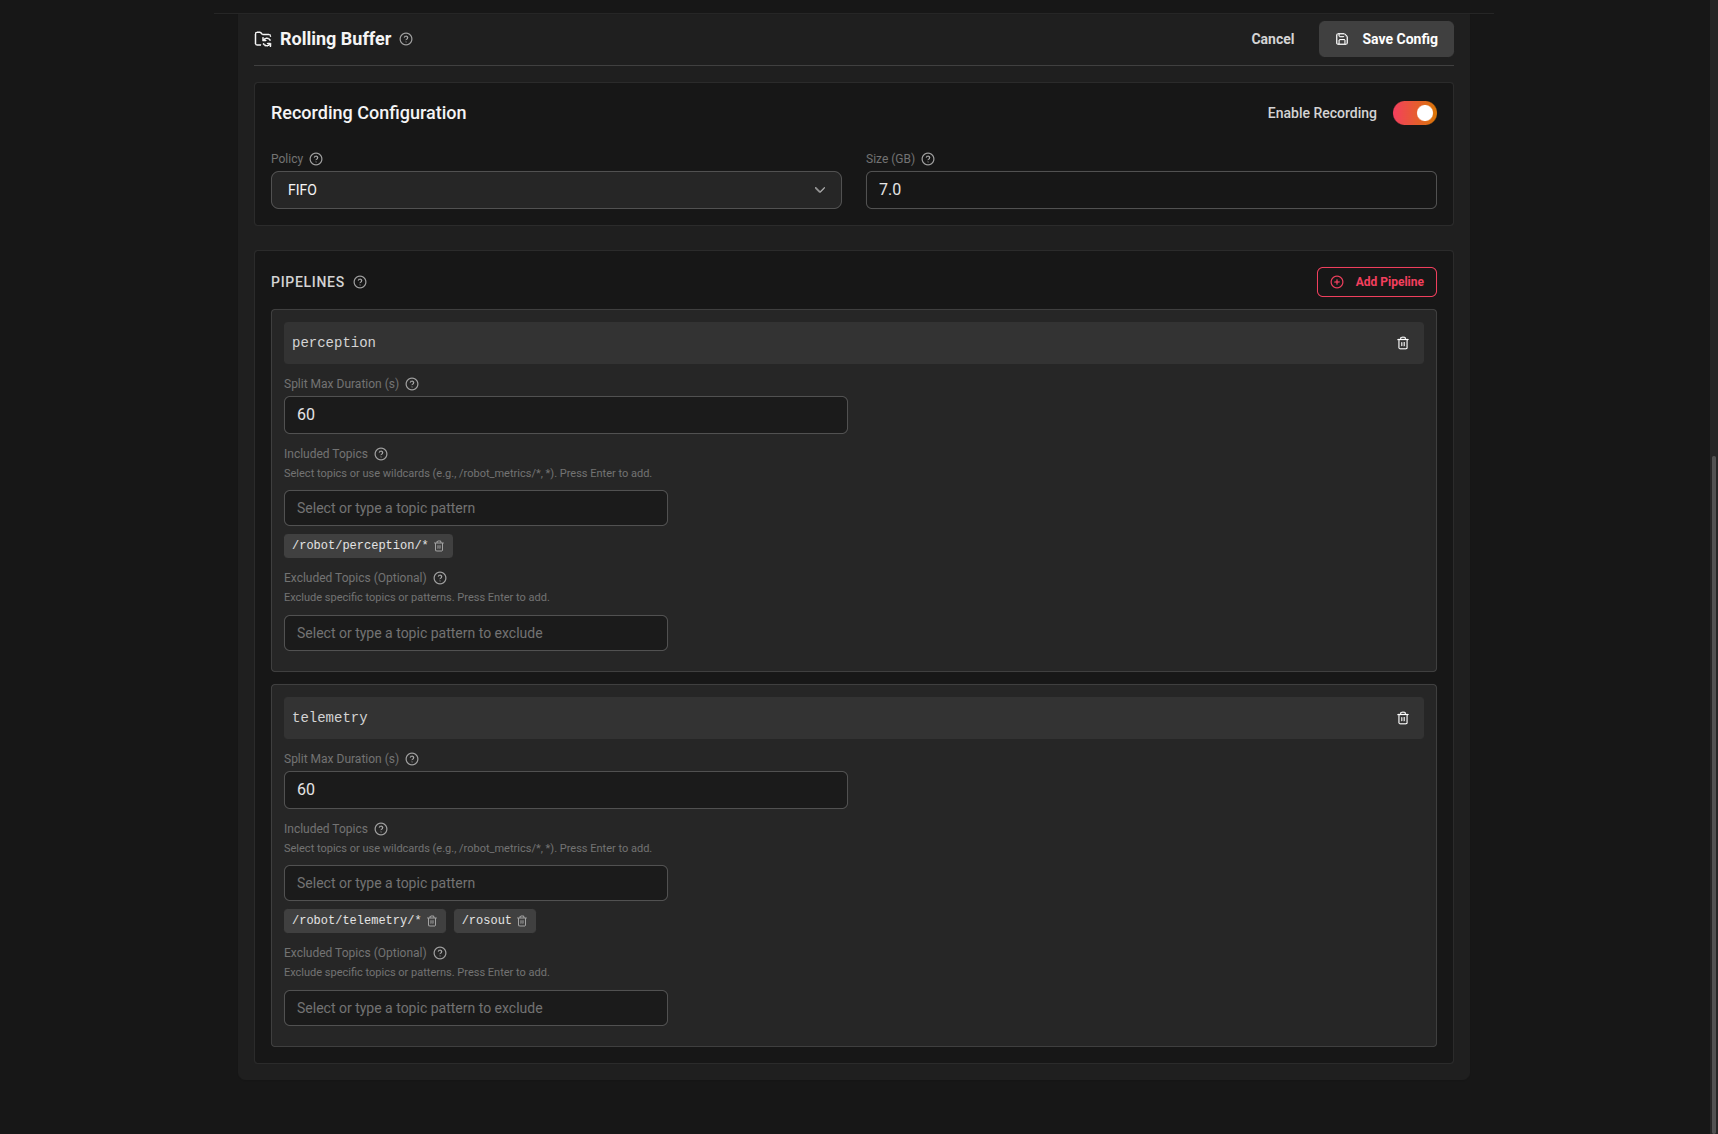
How to configure
- Enable Recording: Toggle the switch to start recording data.
- Set Storage Policy:
- Quota Type:
- FIFO: Oldest data is deleted first (recommended for most users).
- HARD: Recording stops when the quota is full.
- NONE: No limit (use with caution).
- Quota Size: Set the maximum storage size for recordings (in GB).
- Pipelines:
- Define which topics to record (e.g., all, or specific ROS 2 topics).
- Use wildcards to include/exclude groups of topics.
- Set how long each file should be (split duration).
Example use cases
- Debugging: Capture the last hour of sensor data to diagnose issues.
- Compliance: Retain a rolling window of operational data for audits.
- Event Capture: Quickly upload relevant data after an incident.
Best practices
- Keep the quota size reasonable to avoid filling device storage.
- Use topic filters to record only what you need.
- Regularly upload important recordings to the cloud to prevent loss.
Note: Rolling Buffer requires agent version 0.5.0 or later. If unavailable, update your device agent.