- Where to enable or disable OTel ingestion in the web app.
- Where your applications should send OTel data (endpoint and port).
- How to query OTel data in dashboards using otel_metrics, otel_logs, and otel_traces.
- How traces appear in the UI even when you are focused on logs and timeseries panels.
Before you start
To use OpenTelemetry with Insaion, make sure:- The Insaion Agent is installed on the target device.
- The device is registered and visible in the Devices page.
- Your application runs on the same device (or can reach the device where the agent is running).
1) Enable OpenTelemetry ingestion in the frontend
OpenTelemetry ingestion is enabled by default for new devices. To check or change it:- Go to Devices.
- Open the target device.
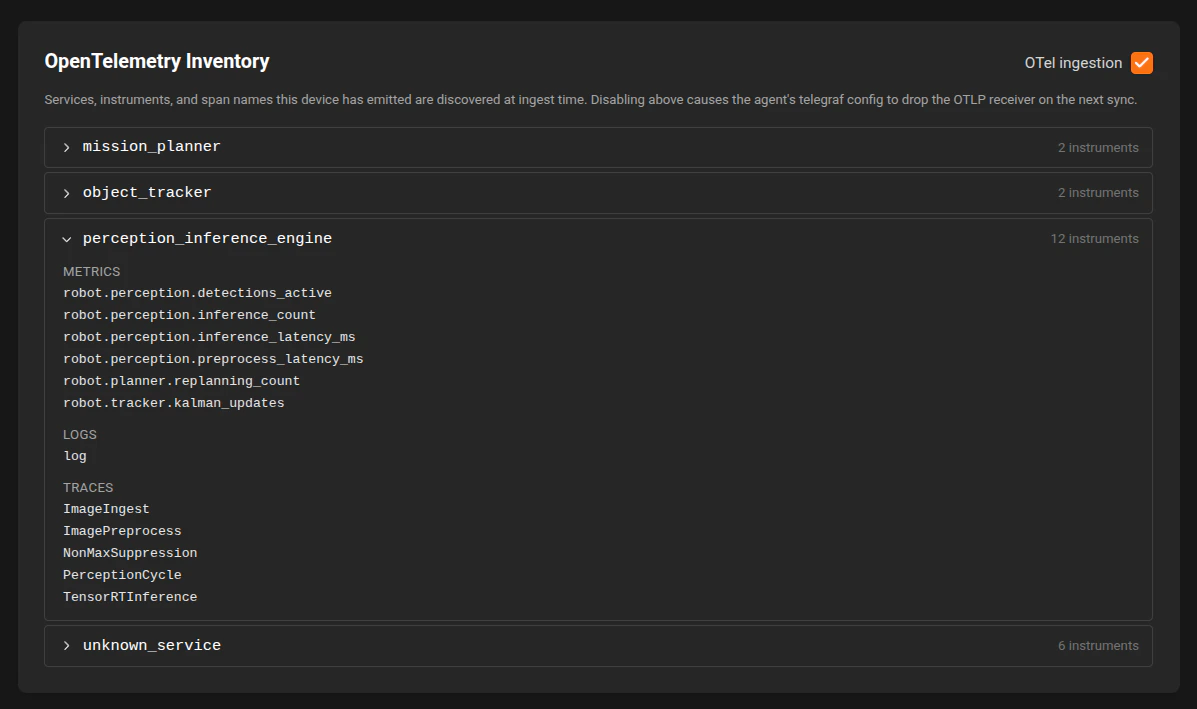
- In Device Details, find the OpenTelemetry Inventory section.
- Use the OTel ingestion toggle.
- Enabled: the agent accepts OTel OTLP/gRPC traffic and ingests it.
- Disabled: the agent stops ingesting OTel data for that device.
2) Send OTel data to the correct endpoint
By default, the agent listens for OTLP/gRPC on:- Host: 127.0.0.1
- Port: 4317
- Endpoint: http://127.0.0.1:4317
- 127.0.0.1 means the exporter must run in the same network namespace as the agent listener.
- If your app runs in a separate container, point it to the host endpoint that reaches the device listener.
- If you send data but see nothing in dashboards, first verify the OTel ingestion toggle is on.
3) Query OTel data in the dashboard Query Builder
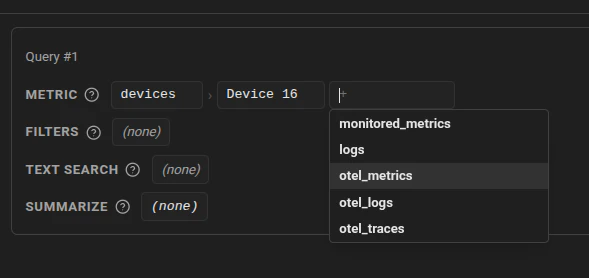
When configuring a panel query, the Query Builder includes OTel data sources. You will see:- otel_metrics
- otel_logs
- otel_traces
- Use otel_metrics for Timeseries, Stat, and Gauge panels.
- Use otel_logs for Logs panels.
- Use otel_traces when you want to explore traces available for the selected range and source.
4) Use the new Logs Query workflow
For Logs panels, use Log Text Search in the query builder. Available match types:- contains
- does not contain
- matches regex
- contains: timeout
- does not contain: healthcheck
- matches regex: (?i)\b(error|critical|fatal)\b
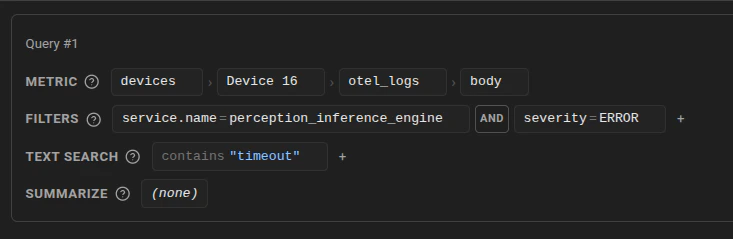
- Start with a broad contains filter, then tighten with regex if you need exact severity patterns.
5) Understand trace discovery in dashboards
Trace exploration is integrated into logs and timeseries workflows:- In Logs panels, rows with a detected trace id show a Trace action.
- In expanded log details, trace_id values are clickable.
- In Timeseries panels, trace exemplars can appear as markers.
- Clicking a trace marker or trace action opens the trace drawer.
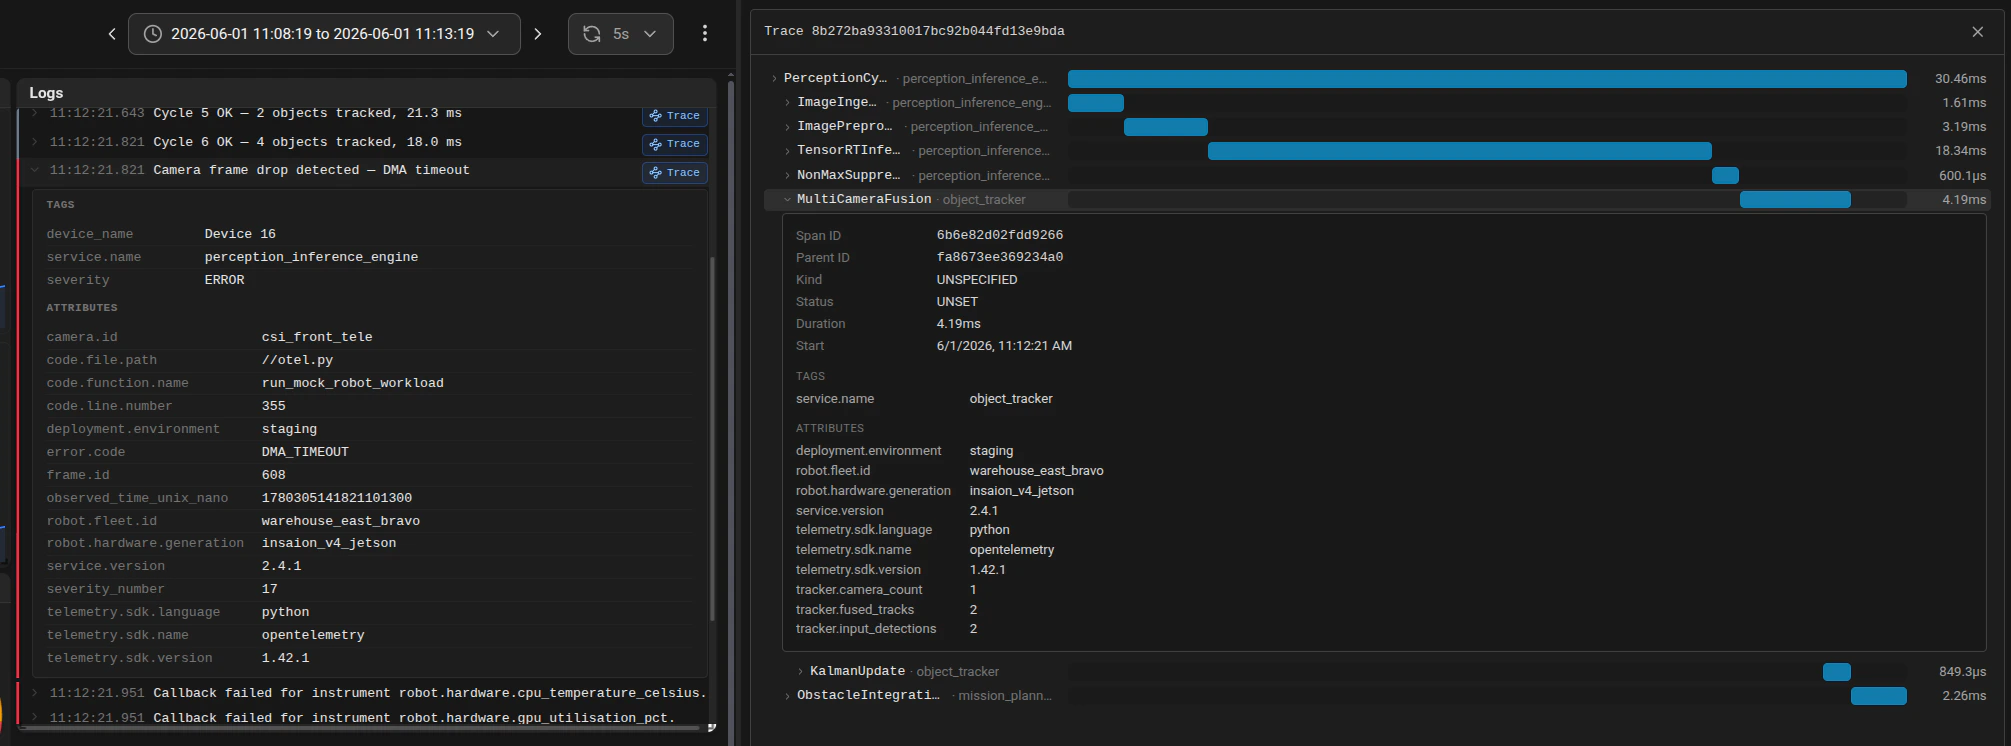
- Trace drill-down is detection-driven. You usually discover traces from logs or metric exemplars, then open them.
- You may not always begin from a standalone trace search flow.
Troubleshooting checklist
If data is missing:- Confirm the device is online.
- Confirm OTel ingestion is enabled in Device Details.
- Confirm exporter endpoint is http://127.0.0.1:4317 and protocol is OTLP/gRPC.
- Confirm your selected dashboard time range includes recent events.
- Confirm your panel query data source matches the signal type (otel_metrics, otel_logs, or otel_traces).