

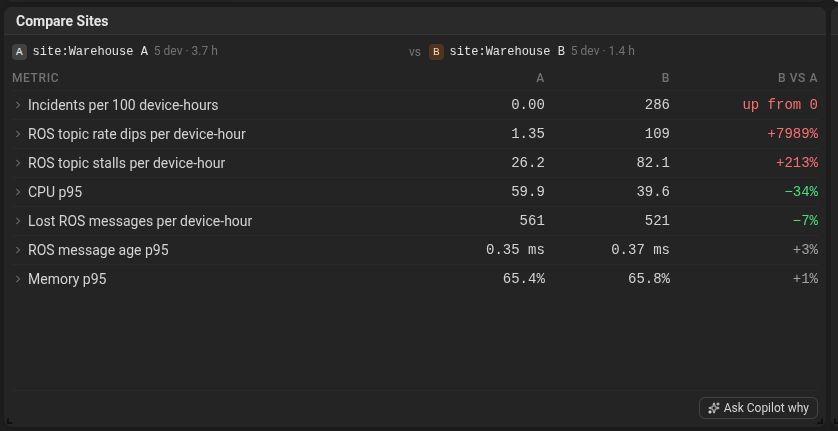
Two ways to compare
Two tag values compares both groups over the dashboard’s time range. Tags count as they were at each moment, so a robot upgraded halfway through counts for
1.4.1 until the upgrade and for 1.4.2 after it.
Before and after compares two periods. Each side can use:
- Previous period: the same length, right before the dashboard’s range. This is the default for A.
- Dashboard range: the dashboard’s current time range. This is the default for B.
- Custom period: any range from the time picker, either fixed dates or a relative range such as the last 7 days.
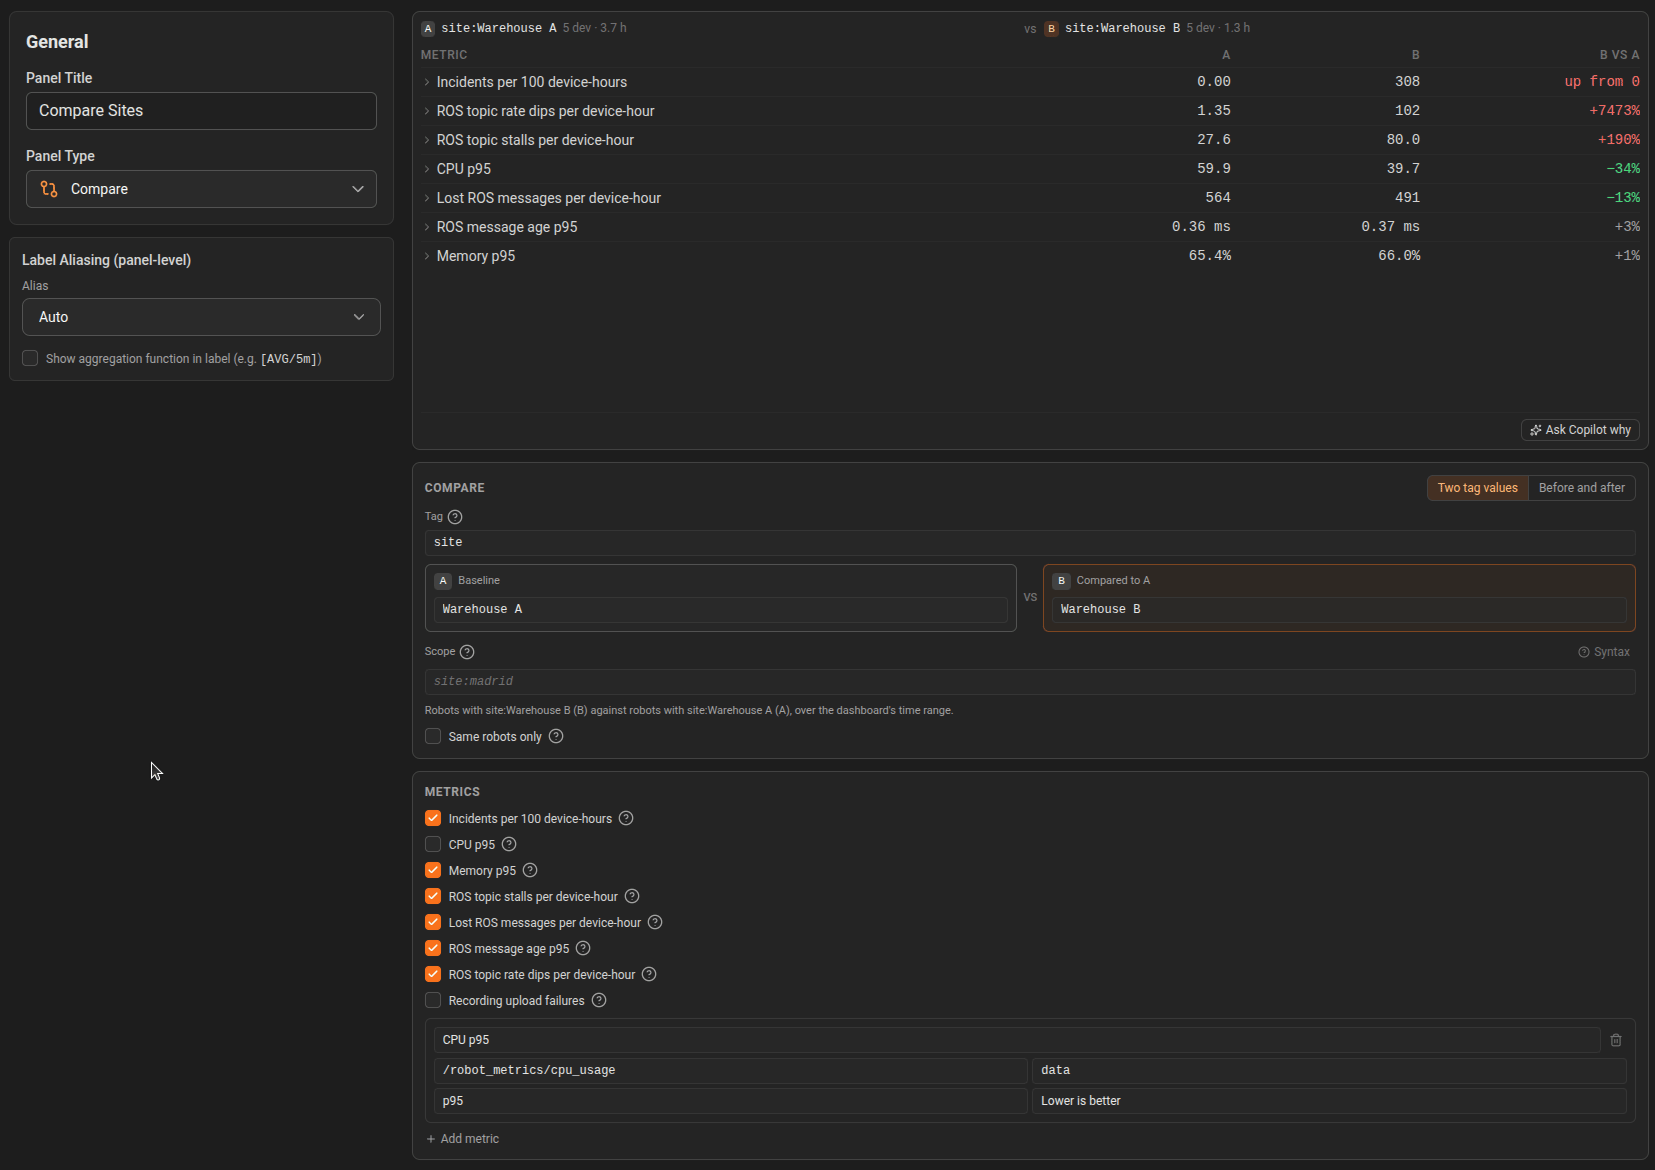
Add a Compare panel
- Open a dashboard and click Add panel, then choose Compare.
- Under Compare, choose Two tag values or Before and after.
- Pick a Tag (any device tag,
site, or a detected tag such asagent.version). - For each side, pick a value (Two tag values) or a time range (Before and after).
- Optionally narrow both sides with Scope, for example
site:madrid. The dashboard’s variables and filters apply too. - Optionally tick Same robots only to keep only robots that reported on both sides, so a different fleet mix does not skew the result.
- Choose the metrics, then save.
From a chart grouped by tag
When a Timeseries panel groups its lines by a device tag, its panel menu offers Compare by <key>. It opens a new Compare panel already set to that tag.Metrics
A new panel starts with these metrics:
You can also turn on:
The ROS topic metrics use the agent’s topic statistics and need agent 1.2.0 or later. Lost messages and message age also need ROS 2 Jazzy or later.
Custom metrics
Click Add metric to compare any numeric field from host metrics, OpenTelemetry or ROS 2 topics. For each one set:- Topic and Field.
- Aggregation: Average, Median, p95, p99, Minimum, Maximum, or Samples per device-hour.
- Direction: Lower is better, Higher is better or No direction. The direction decides whether a change is colored as better or worse.
- Label (optional), shown in the table instead of the field name.
Read the results
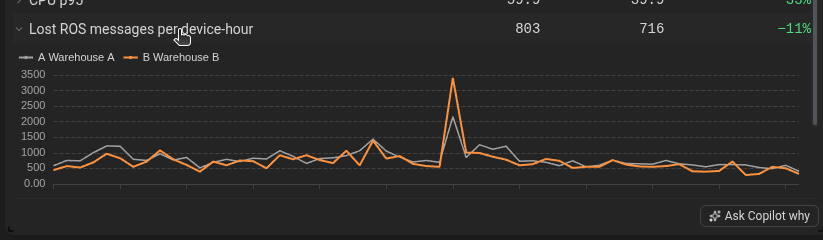
- A and B: the metric on each side.
- B vs A: how B differs from A, relative to A, for example
+12%. A metric that moved away from zero reads up from 0 or down from 0.
cpu:cpu-total), the footer says how many were not applied: data tags filter the rows of one metric, not which robots are compared.
Tips
- Compare like with like. Use Scope or Same robots only when the two groups differ in site, customer or workload.
- Check the device-hours in the header before trusting a large change. A few robots for a few hours can swing a percentage a lot.
- For a rollout, set
software_versionwith the real rollout time on the device tags, then use Two tag values on that key. - Add a Compare panel next to a Timeseries panel with Show Tag Changes on, to see both the summary and the moment things changed.